

R&D LAB Computational Design Study A fictional scheme, not a real development
Property Navigator
A 3D navigator for a housing scheme, generated entirely in code
47 homes on a hillside, generated entirely from code. Sun hours, outlook and price are measured, not typed in.
- 47homes, generated from one masterplan table
- 26view rays per home, traced against the real massing
- 0model files, textures and environment maps in the project
- 6readings of the same model, from site to floor plan
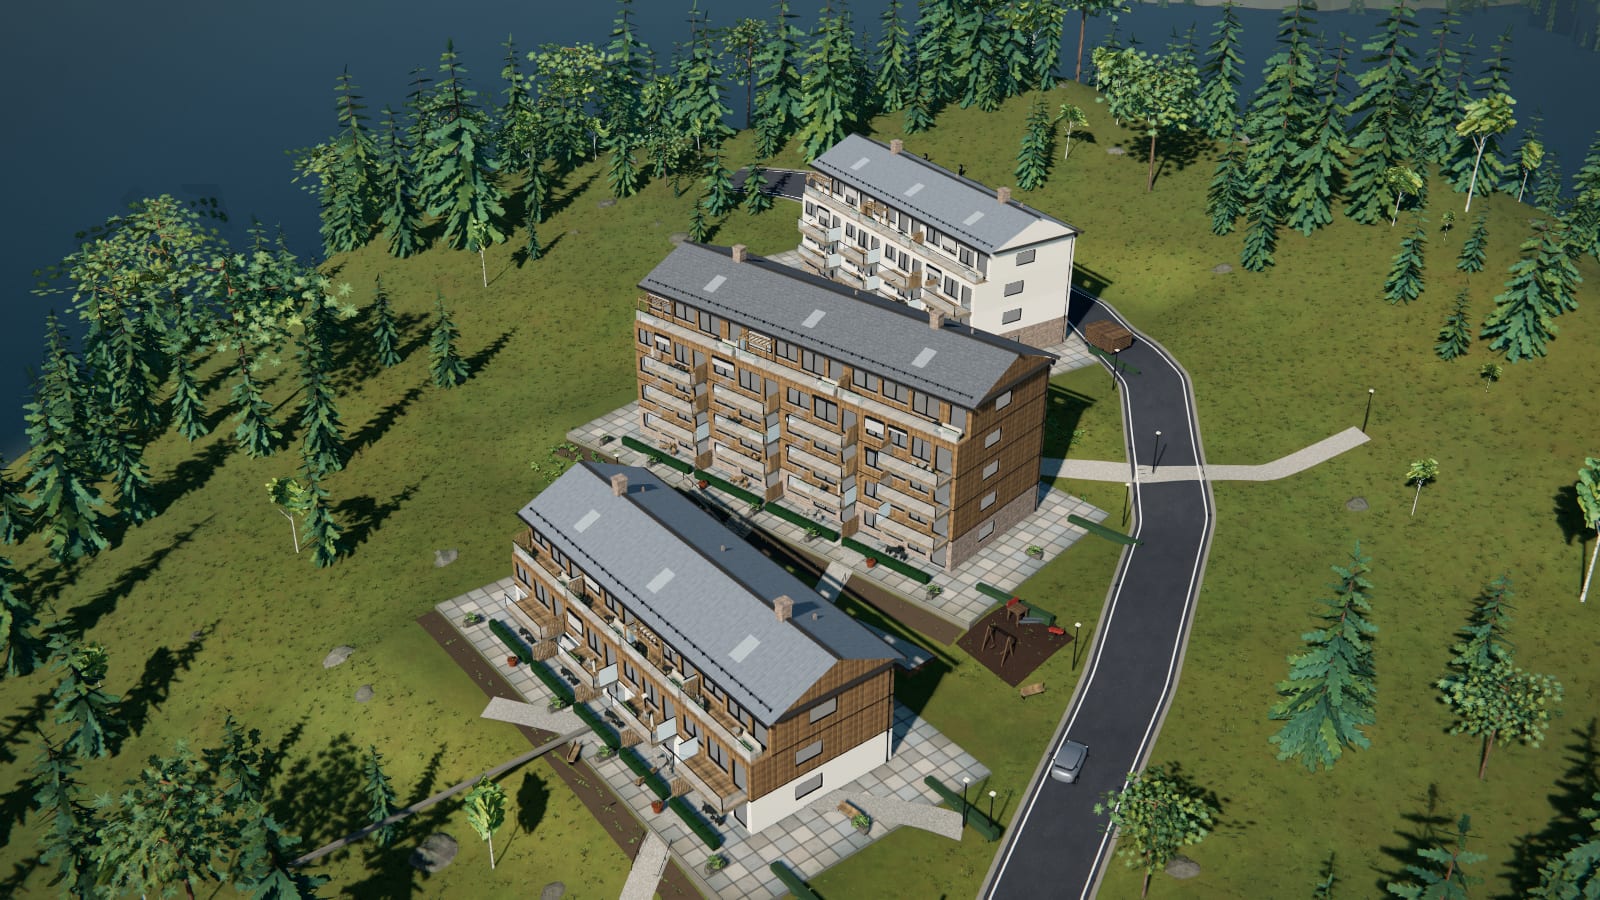
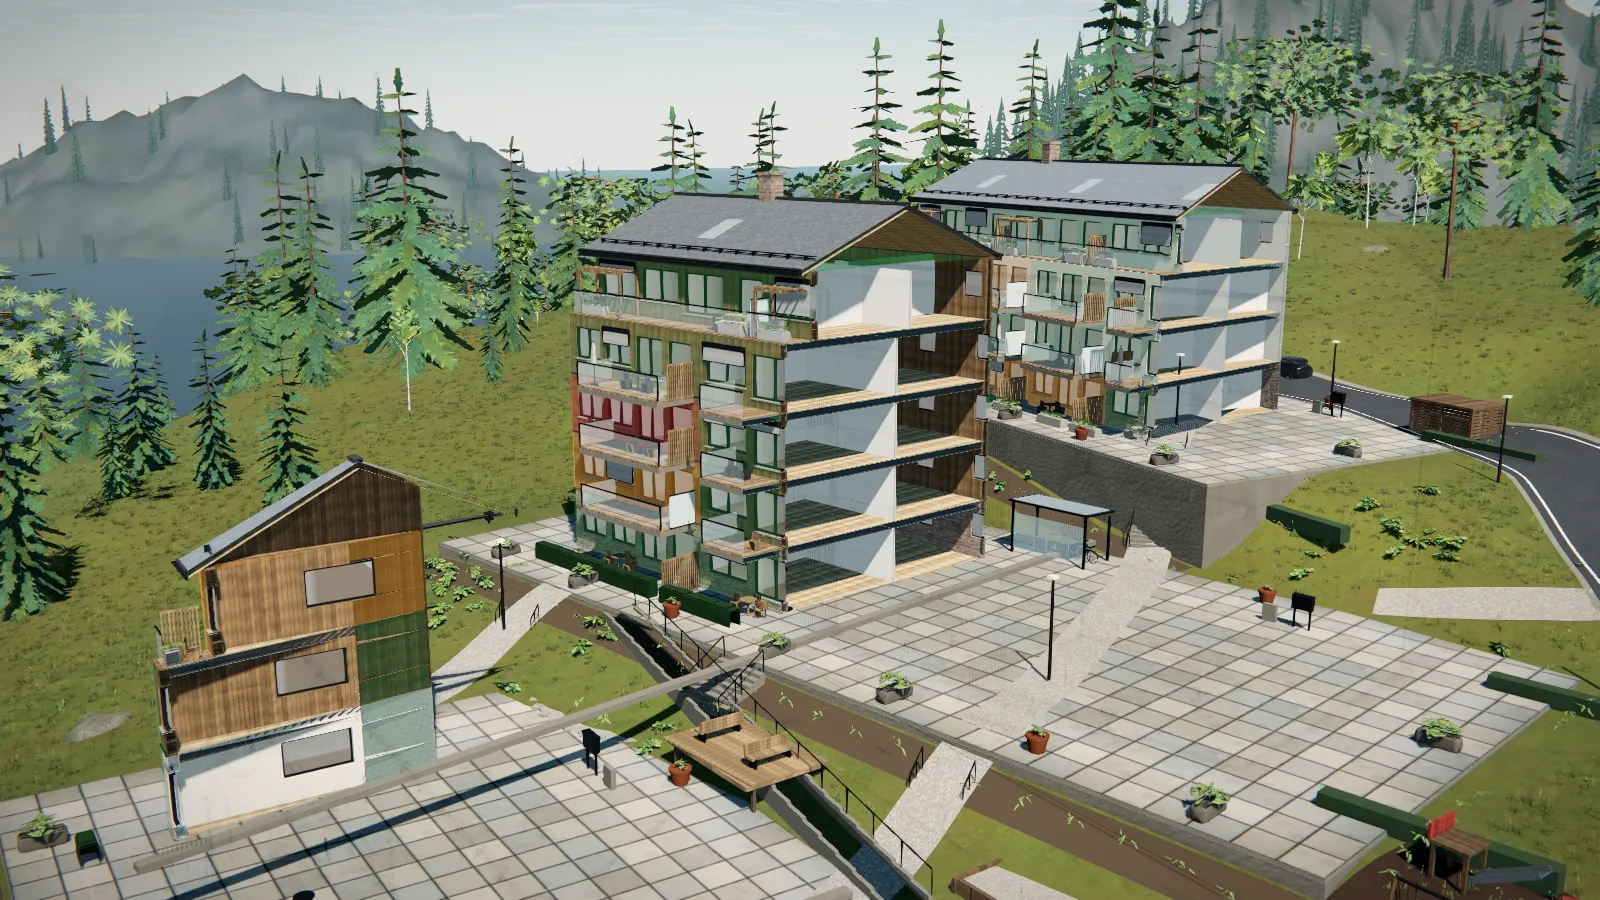
The masterplan viewpoint, 74 metres above the site, 21 June at 17:00. Terrain, trees, grass, brick and larch are not files in the project; they are drawn at load.
Why this is published
We publish this because a sales tool for a development is usually a set of rendered images beside a price list maintained somewhere else, and the two drift apart by the second design revision. Here they hang off the same computation. For clients we build navigators and configurators like this as standalone web applications, bound to the data model that is being maintained anyway: a property, a plant or a product variant. That covers computational design, XR and 3D in the browser, and the software around them.
Solvik Terrasse is a housing scheme that does not exist: 47 homes in three terraced blocks on a wooded hillside above the water. The browser navigator generates that scheme again on every load, out of one table of block lengths, storey counts and home widths. The project contains no model file, no downloaded texture and no environment image: terrain, facades, brick, larch, zinc and planting are all drawn in code. The interesting part is not the graphics, it is the coupling. Sun hours per home are traced against the actual massing and the terrain height field, outlook is measured with a fan of 26 rays per home, and both measurements feed back into the score and therefore into the price. A home whose view is taken by the block in front is measurably cheaper, without anyone having typed that in. Change the masterplan and the geometry, the floor plans, the analysis, the price list and the sales position all change with it.
The whole instrument in one frame
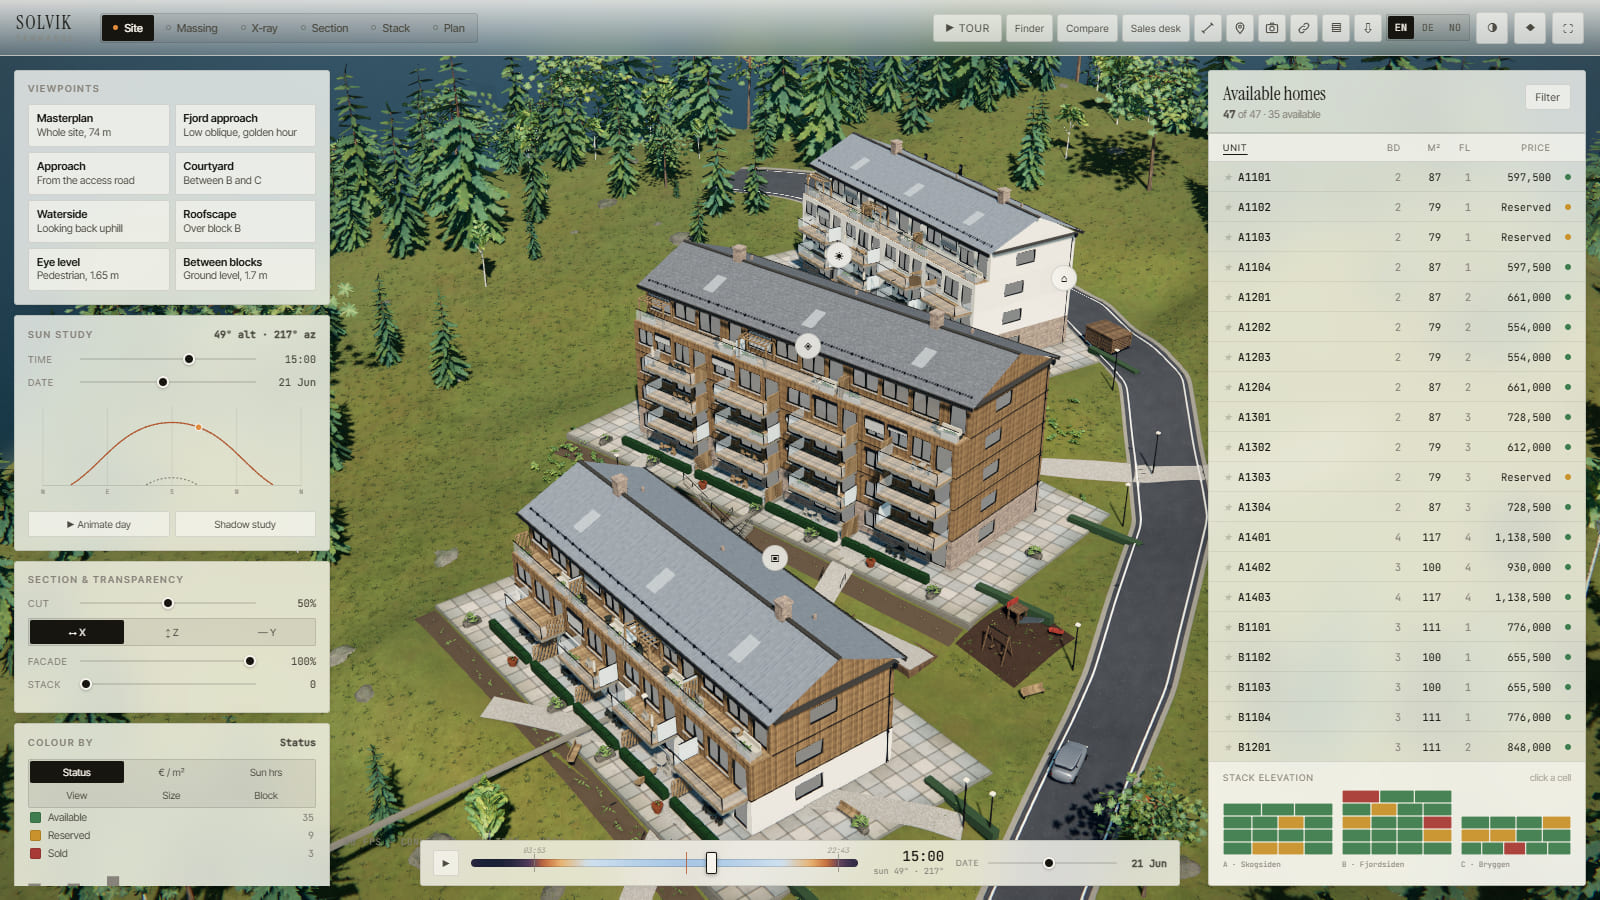
The top bar carries the six readings of the same model: Site, Massing, X-ray, Section, Stack and Plan. None of them is a second model; each one draws the same 47 records differently.
On the right sits the schedule of homes with bedrooms, area, storey and price, and under it the stack elevation as a coloured cell per home. The line above the list counts 47 of 47 homes and 35 available. Those two numbers are counted as well, not maintained.
The decision
Why none of these numbers sits in a list
The usual arrangement for a development is two things that know nothing about each other: a set of rendered images and a price list in a spreadsheet. By the second design revision one no longer matches the other, and nobody notices, because a picture never contradicts anything. The decision at the start of this project was therefore a simple one: whatever can be computed is computed, and nothing is maintained twice.
What makes that affordable is a trick that does not look like graphics. Sun and outlook are not traced against the 1,452,902 triangles actually drawn, but against oriented bounding volumes of the three blocks and, further out, against the height function of the terrain. A ray costs a few dozen arithmetic steps instead of a search through a mesh, and the complete analysis of all 47 homes is finished at boot rather than after a night on a render farm.
What follows from it hangs together. The price per square metre starts at 7,450 euro and is multiplied by storey, corner position, top floor, block position and the measured outlook. Home B1403 lands at 8,612 euro per square metre, and inside that figure sits its 76 percent open horizon. The price list, the comparison sheet, the sales desk and the printed fact sheet then read the same fields, which is why they cannot drift apart.
Everything visible is produced the same way. A wall is decomposed into rectangles around its openings, so reveals and sills come out without any boolean operations. Brick, lime render, larch, zinc and slate are painted onto canvases, with normal maps derived from a matching height canvas. Each pane carries the room type behind it and the identifier of its home, so wall tone, floor and night lighting stay consistent per home.
The honest price of building it this way is the bounding volume itself. It is an approximation, and an approximation can be wrong. In the build captured here, 18 of the 47 homes report exactly zero sun hours on all three dates, because their sample point falls inside the bounding volume of their own block and every ray is therefore reported blocked. In a rendering nobody would ever have seen it. It becomes visible only because there is a number standing there, claiming something.
A measured number can be wrong. A typed number can only be wrong unnoticed.
From the facade to the figure
How a home arrives at its daylight figure
- 01 Three sample points off the facade 90 centimetres off the living room facade, spread across the width of the home and at 35, 55 and 75 percent of the storey height. Not one point, because a home does not live at one point.
- 02 The day is walked through From sunrise to sunset in 20 minute steps at the equinox and 25 minute steps at the two solstices. Below 2.5 degrees of solar altitude a step does not count.
- 03 Each step throws three rays One ray per sample point, against the oriented bounding volumes of all three blocks and, further out, against the terrain height function. The home's own block counts too, because a north facade shades itself.
- 04 Hits become hours For each step the share of unblocked points is recorded, summed across the day and multiplied by the step length. For home B1403 that gives 5.7 hours at the equinox.
- 05 Three dates, not one Day 79, 171 and 355 of the year. B1403 comes out at 5.7, 8.9 and 2.1 hours. Only the three side by side tell you whether a home is a summer home.
- 06 The figure feeds back into the price The same pass measures outlook with 26 rays: open horizon and share of water. Both enter the score, and the score enters the price per square metre. That is why B1403 carries its 76 percent open horizon inside its 8,612 euro.
Same model, different reading
Three views onto the same computation
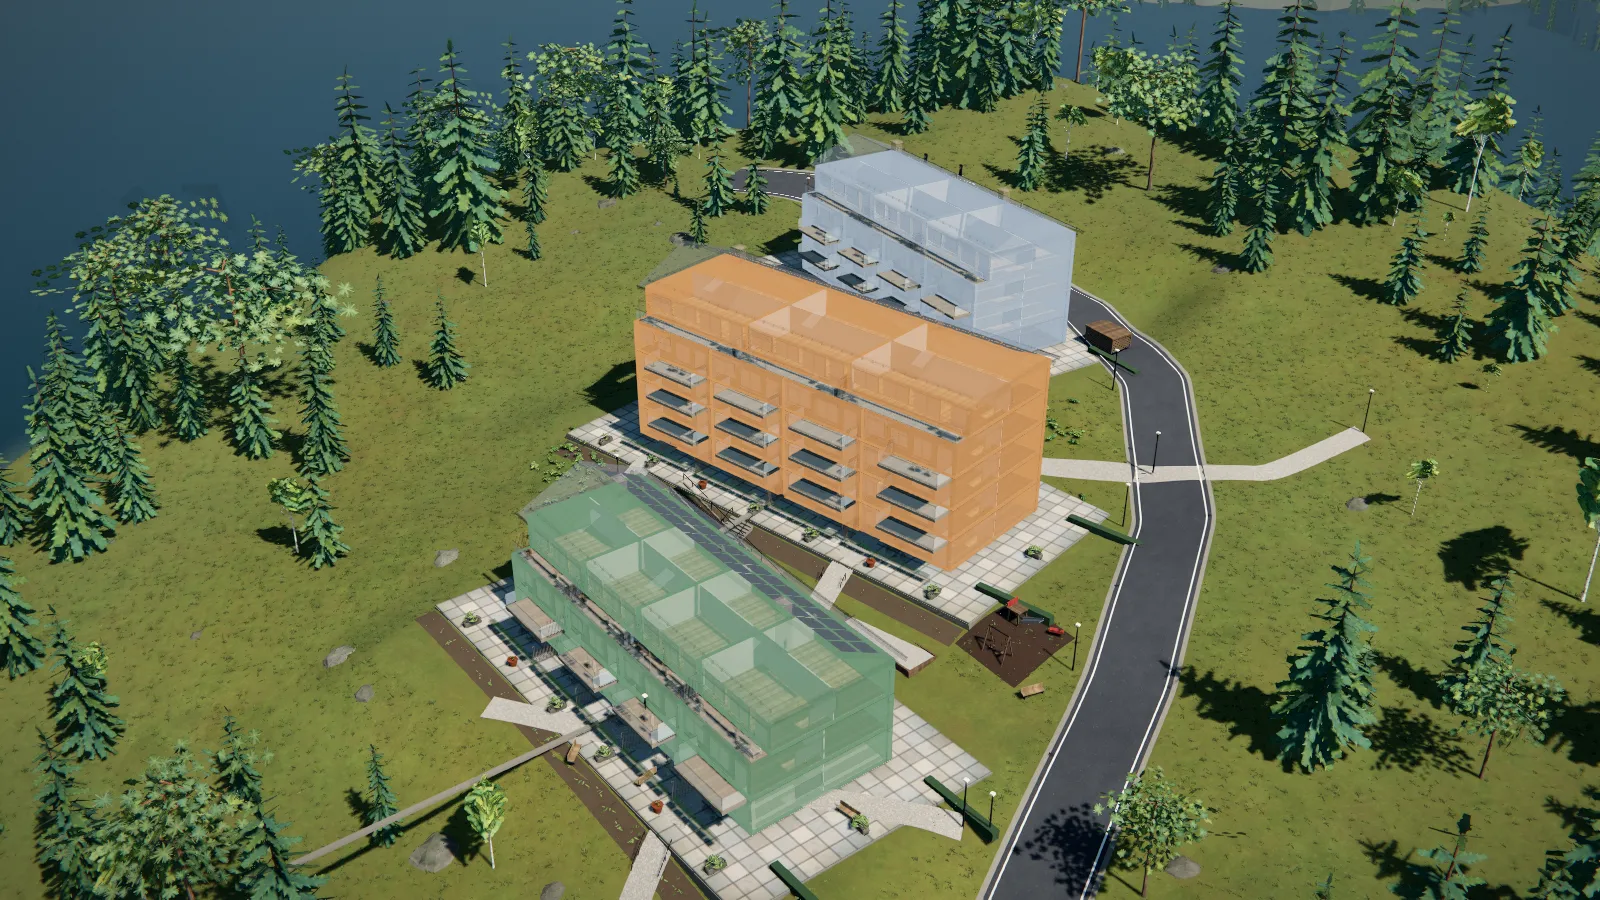
X-rayThe facade ghosts out and each home becomes a coloured volume over the real slabs and party walls. The colour follows the chosen legend: sales status, price per square metre, area, outlook, sun hours or block.
DaylightThe shadow envelope colours the ground by hours of direct sun on the selected day, from 0 to 17.3 hours on 21 June. The grid is 1.5 metres, and the application prints its own compute time under the legend, here 488 milliseconds.
CompareUp to three homes side by side, with floor plan, price, area, sunlight on the three dates and the measured share of water in the view. The best figure in each row is marked, and several of those rows are exactly the fields the price is built from.
In over the water and up to the masterplan
Five sliders, and no opinion behind them
The finder weights five quantities: sun, outlook, quiet, value and space. A home is not scored absolutely but by its rank among all 47, and hard constraints such as bedrooms, budget, terrace, parking and availability cut the list first. What is left is an order that follows entirely from the measured fields.
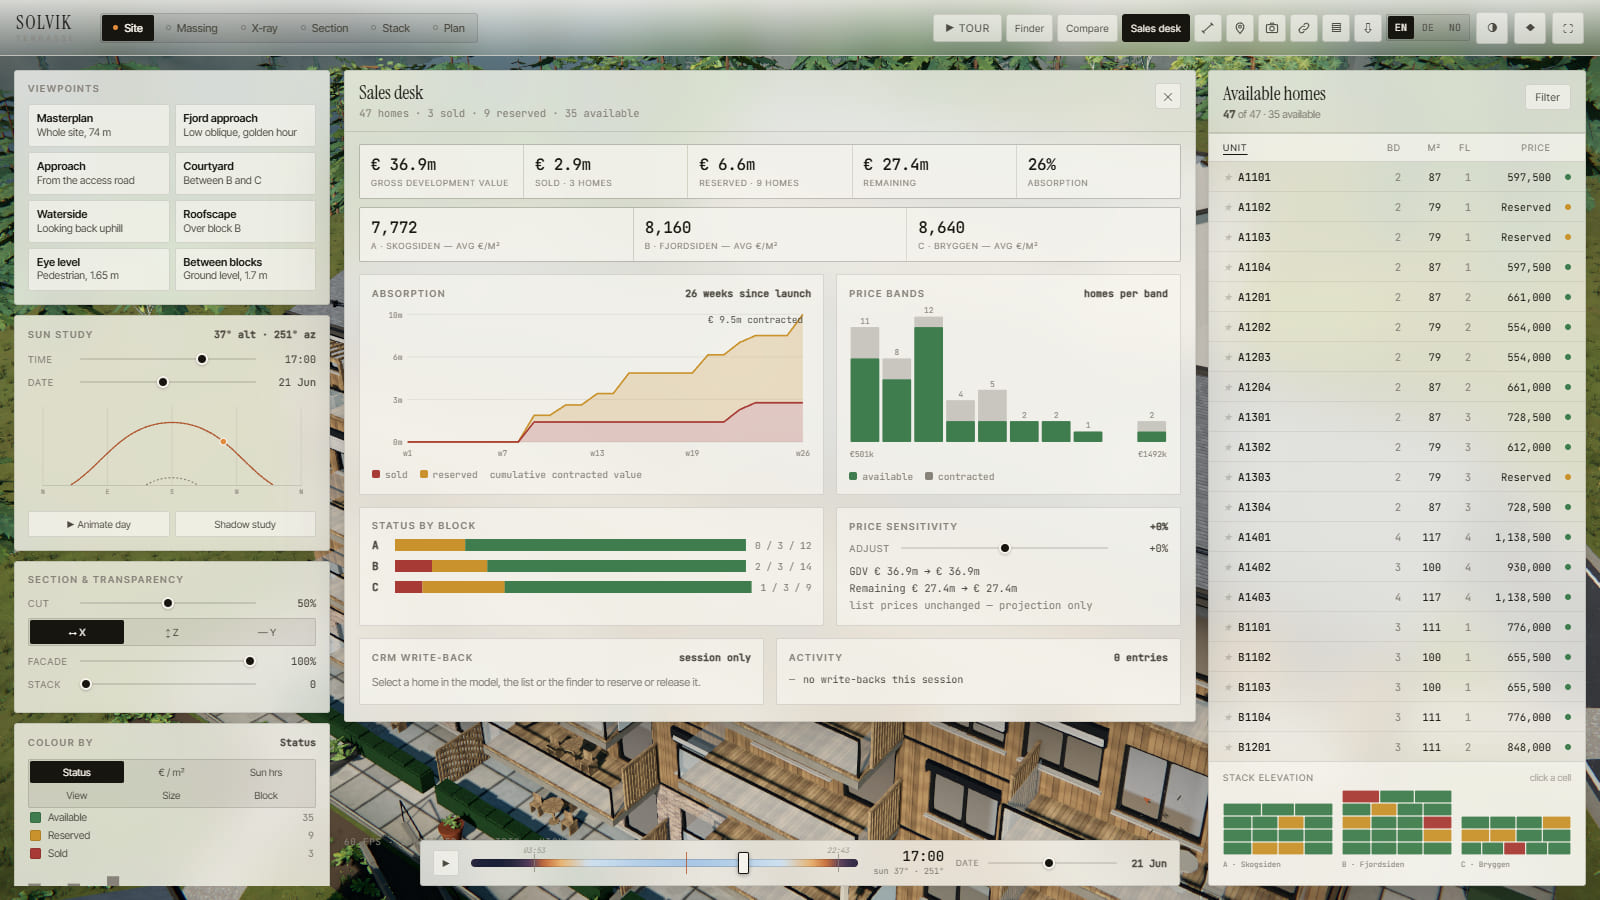
The reason printed under each result is generated rather than written. It reads the same values and puts them in a sentence: water in 50 percent of the view, top 15 percent for sun, the largest home here, corner home, roof terrace. The sales desk beside it counts 35 available, 9 reserved and 3 sold homes out of the same list.
What is computed and what is invented
Computed
- Massing, facades and floor plans for all 47 homes, out of a table of block lengths, storeys and home widths.
- Sun hours per home on three dates, traced against its own massing and its neighbours'.
- Outlook across 26 rays: open horizon, mean view distance and share of water in the field of view.
- Hours of direct sun at ground level on a 1.5 metre grid, computed when the overlay is switched on.
- Price per square metre from area, storey, corner position, top floor, block position and measured outlook.
- Load for one capture: 1,452,902 triangles and 2,323 draw calls per frame at 1600 by 900 pixels.
Invented
- The scheme itself. There is no development of this name, and no figure comes from a real project.
- The block names Skogsiden, Fjordsiden and Bryggen, and their split into 15, 19 and 13 homes.
- The starting value of 7,450 euro per square metre, from which the whole price list follows.
- The sales position. Sold, reserved and available come out of a formula with a fixed seed.
- The location. The solar computation uses about 59.9 degrees north on the Oslofjord; no plot there is part of this.
- Any statement about building regulations or standards. None of it has been held against a statutory daylight assessment.
Massing, section and the sales stand
Where it fits
- Developers who do not want to maintain a schedule of homes and a 3D model separately.
- Off-plan sales, where outlook and sunlight are what the purchase decision actually turns on.
- Architecture and project management teams laying masterplan variants side by side with their consequences for area, daylight and revenue.
- Any product with many variants whose configurator today is a set of rendered images.
Image credits: every frame on this page is a screenshot of our own application. The scheme, the names, the prices and the sales position are invented.
“If a number could be computed, compute it.”
Why this is published
What this means for your project
More from the lab
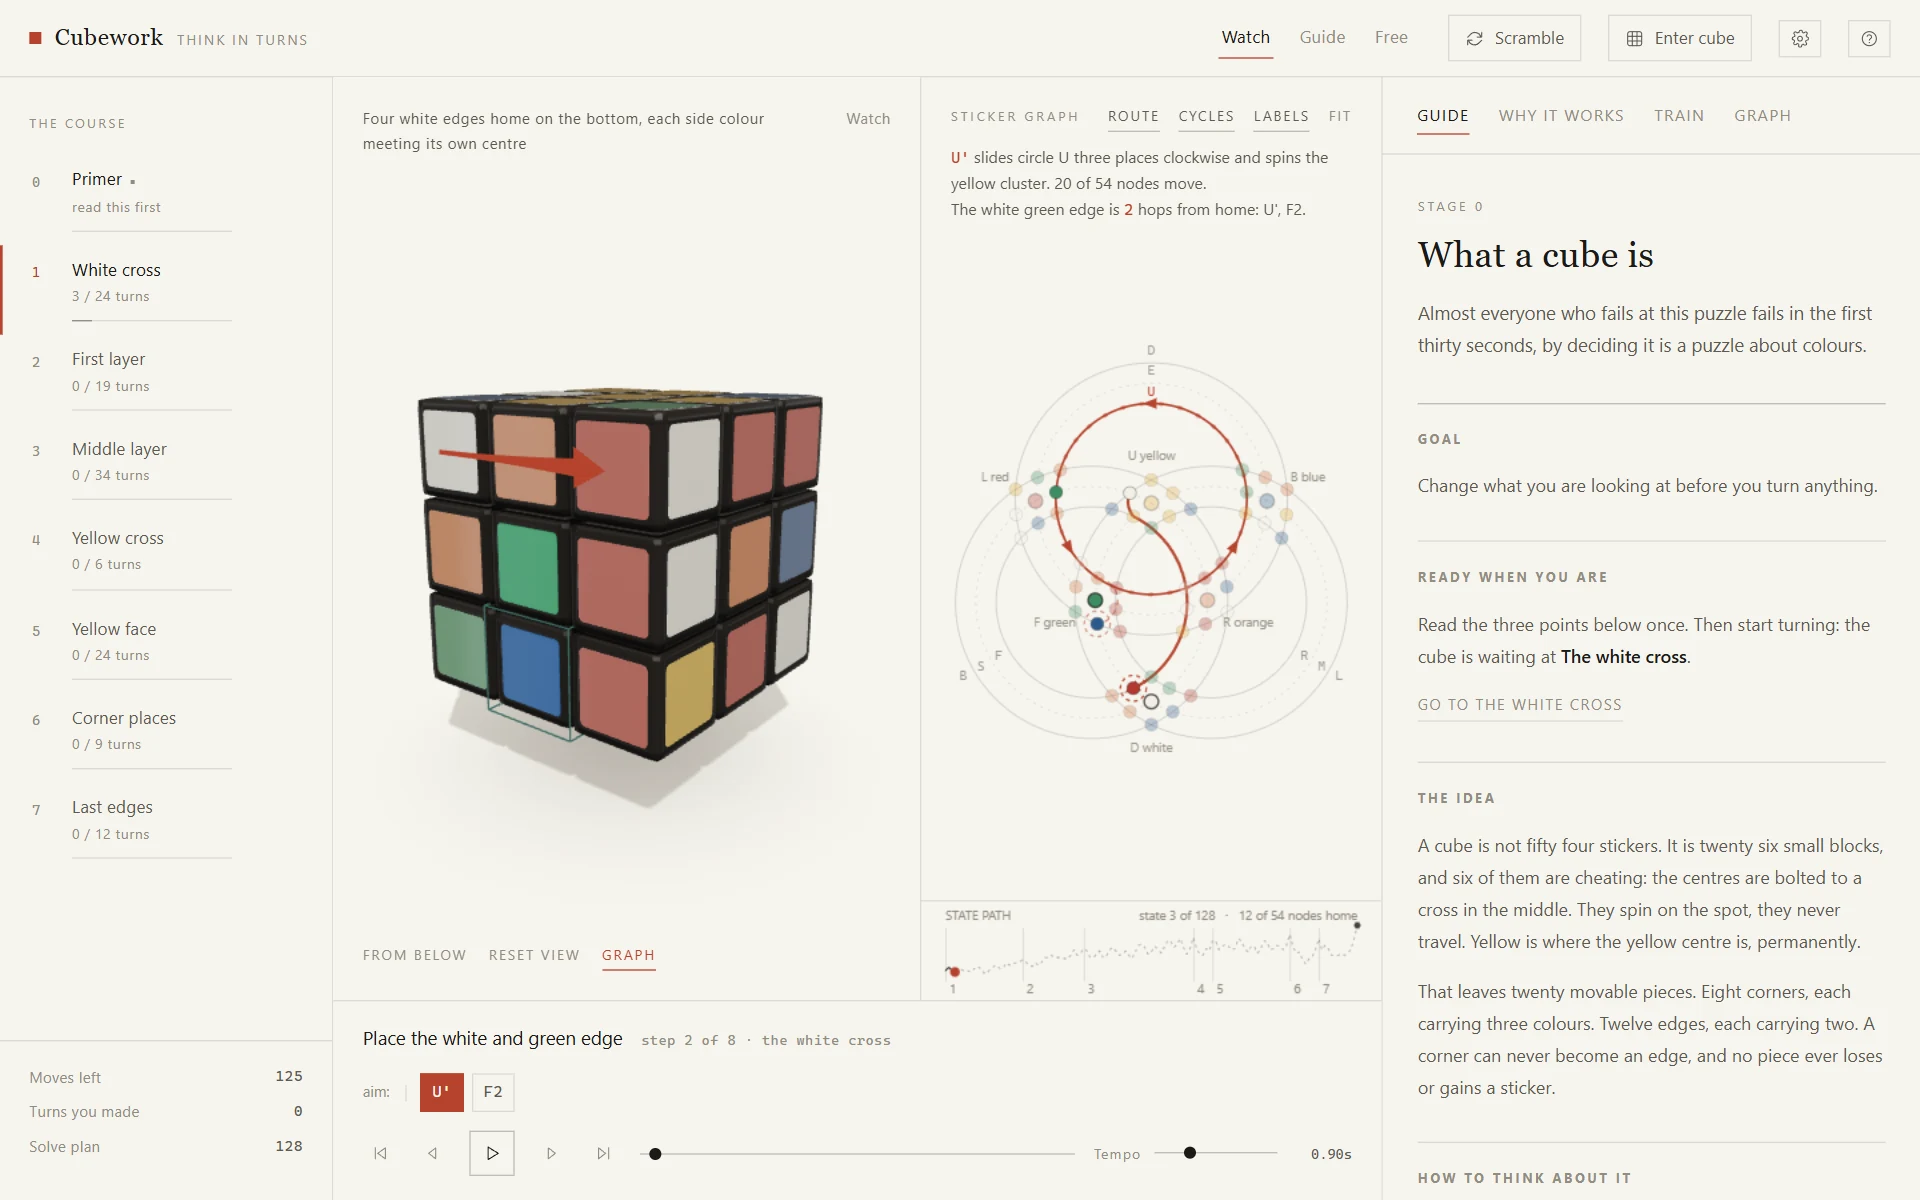
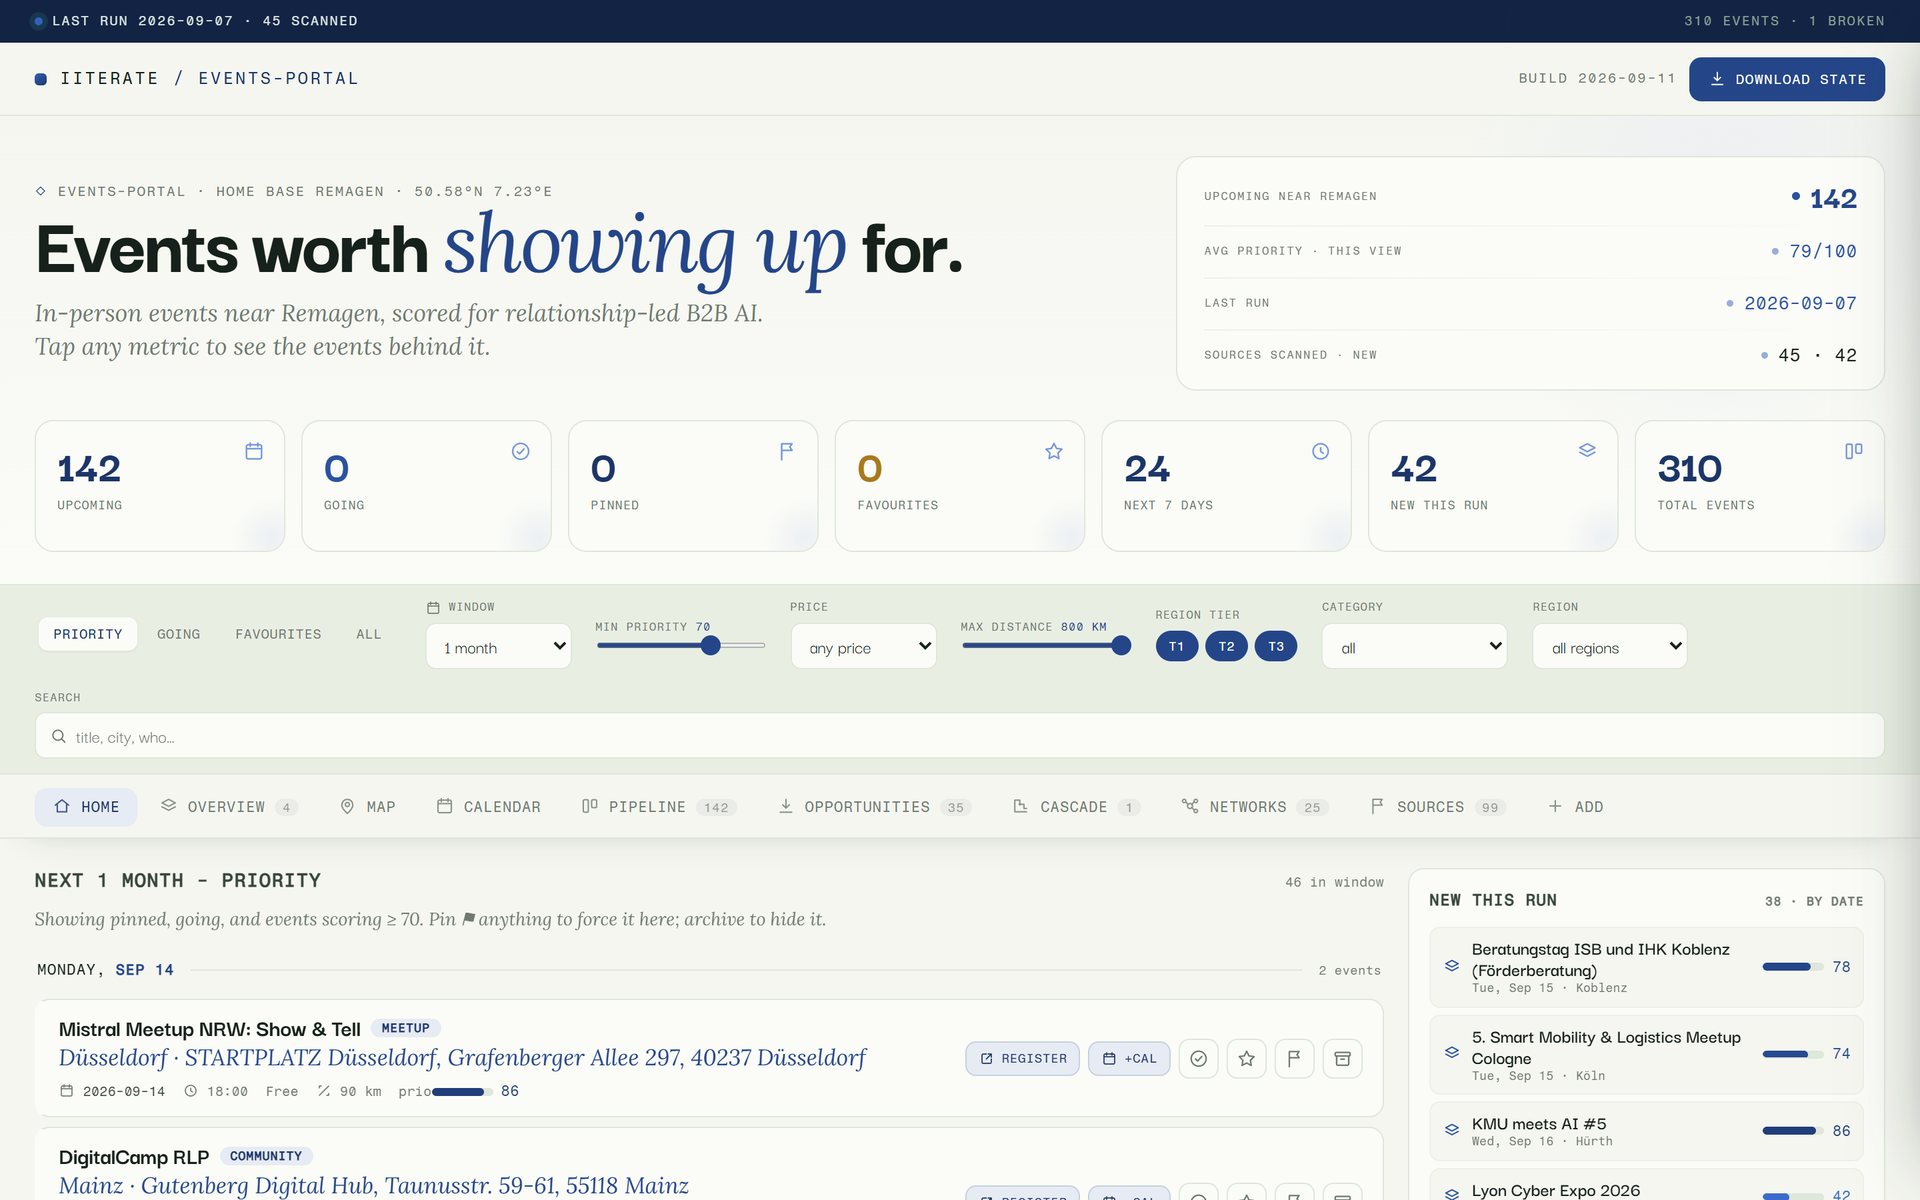 Method Event Scout A language model reads the event pages; everything else is fixed code. What remains is a short list of where a day in person is worth it.
 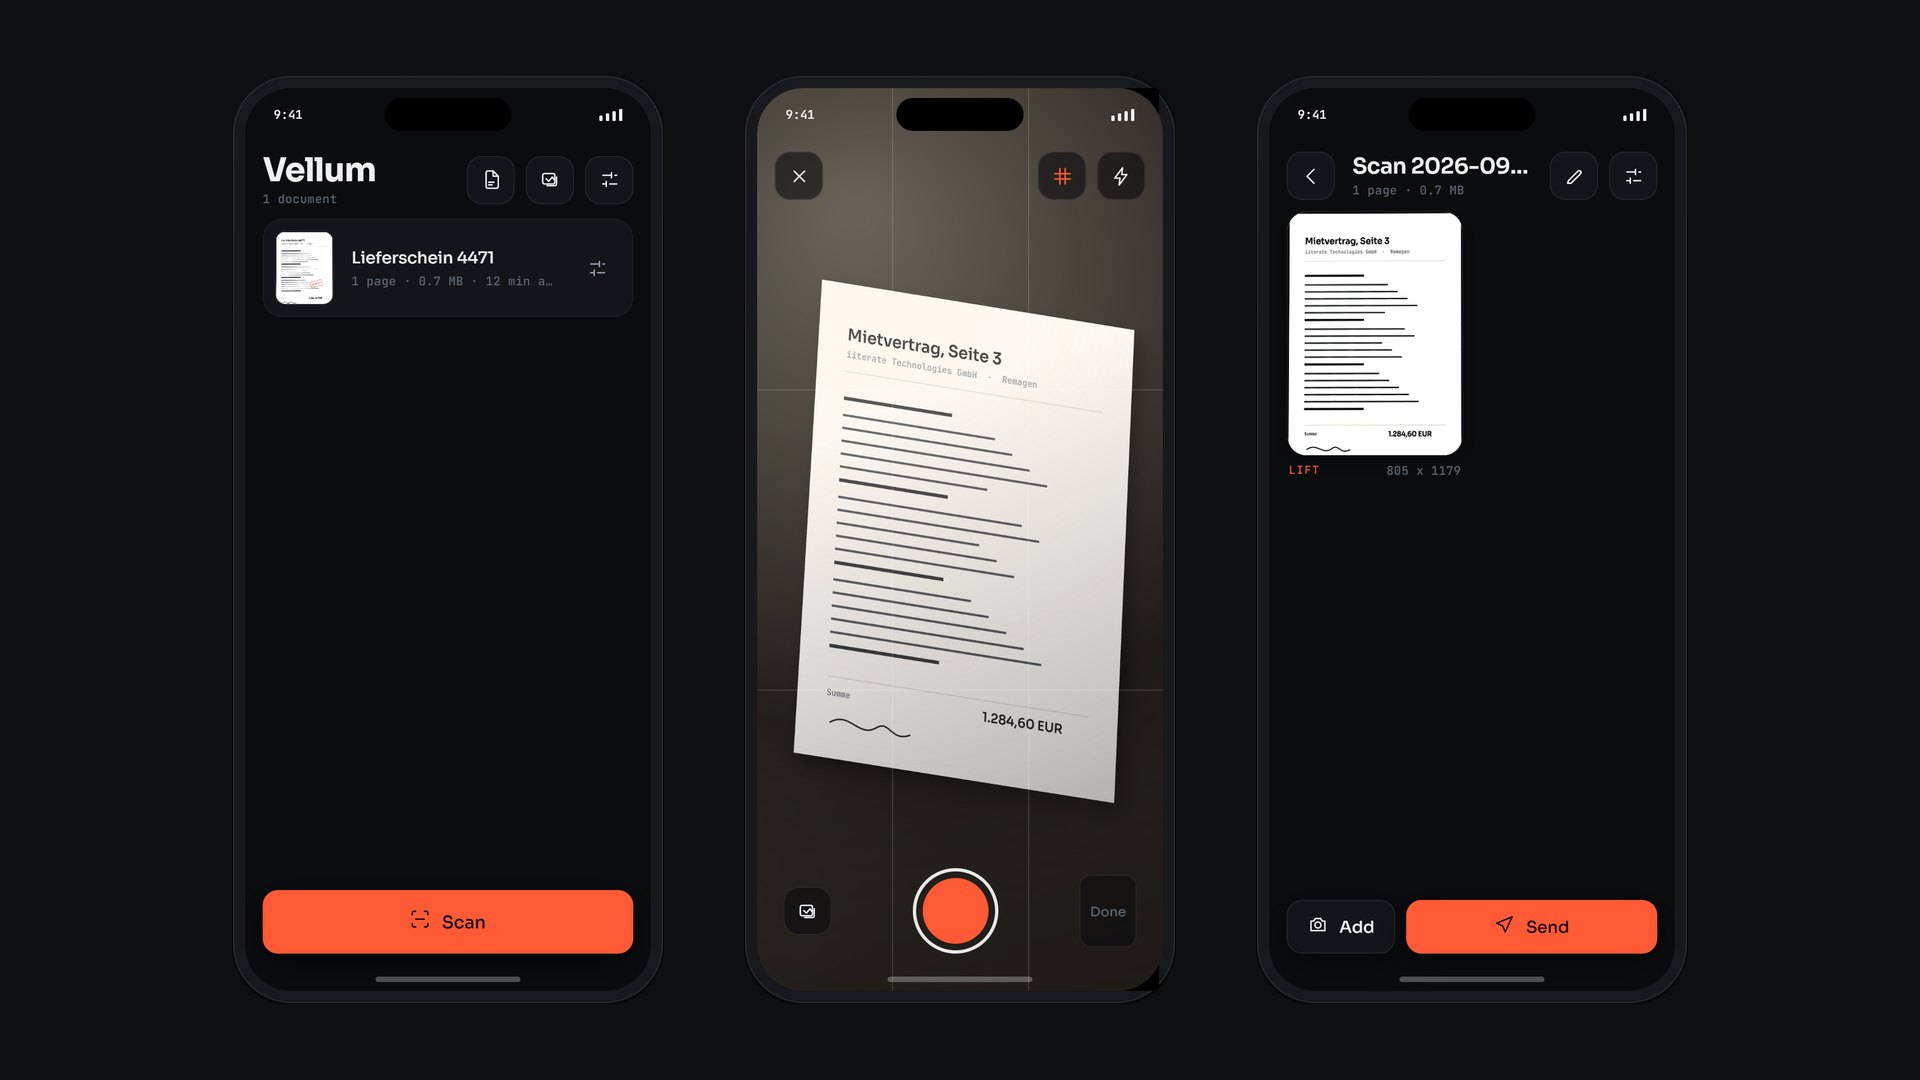 Applied Research Vellum Edges, perspective, light and text are all worked out on the phone. A document leaves the device only when someone sends it.
 Do you have something that has to be explained and sold before it is built? A pilot shows within a few weeks how much of it can come out of your own data.
Get in touch