

R&D LAB Method Complete, not published Learning instrument
Cubework
Learning the puzzle cube through graph theory: layer method, sticker graph and state space
A cube solver that teaches reasons, not move lists: seven stages, a live sticker graph linked to the cube, and the solve drawn as a path through the state graph.
- 7stages, each with a thinking move
- 54 · 9points on circles in the sticker graph
- 6animated graph theory lessons
- 1HTML file that runs offline
Why this is published
Many products have more states than a manual can show: configurators with rules, assembly sequences, processes with dependencies. The people using them need more than the answer; they need the reason for the next step. Cubework is our evidence that a very large state space can be shown so that a person understands it one step at a time.
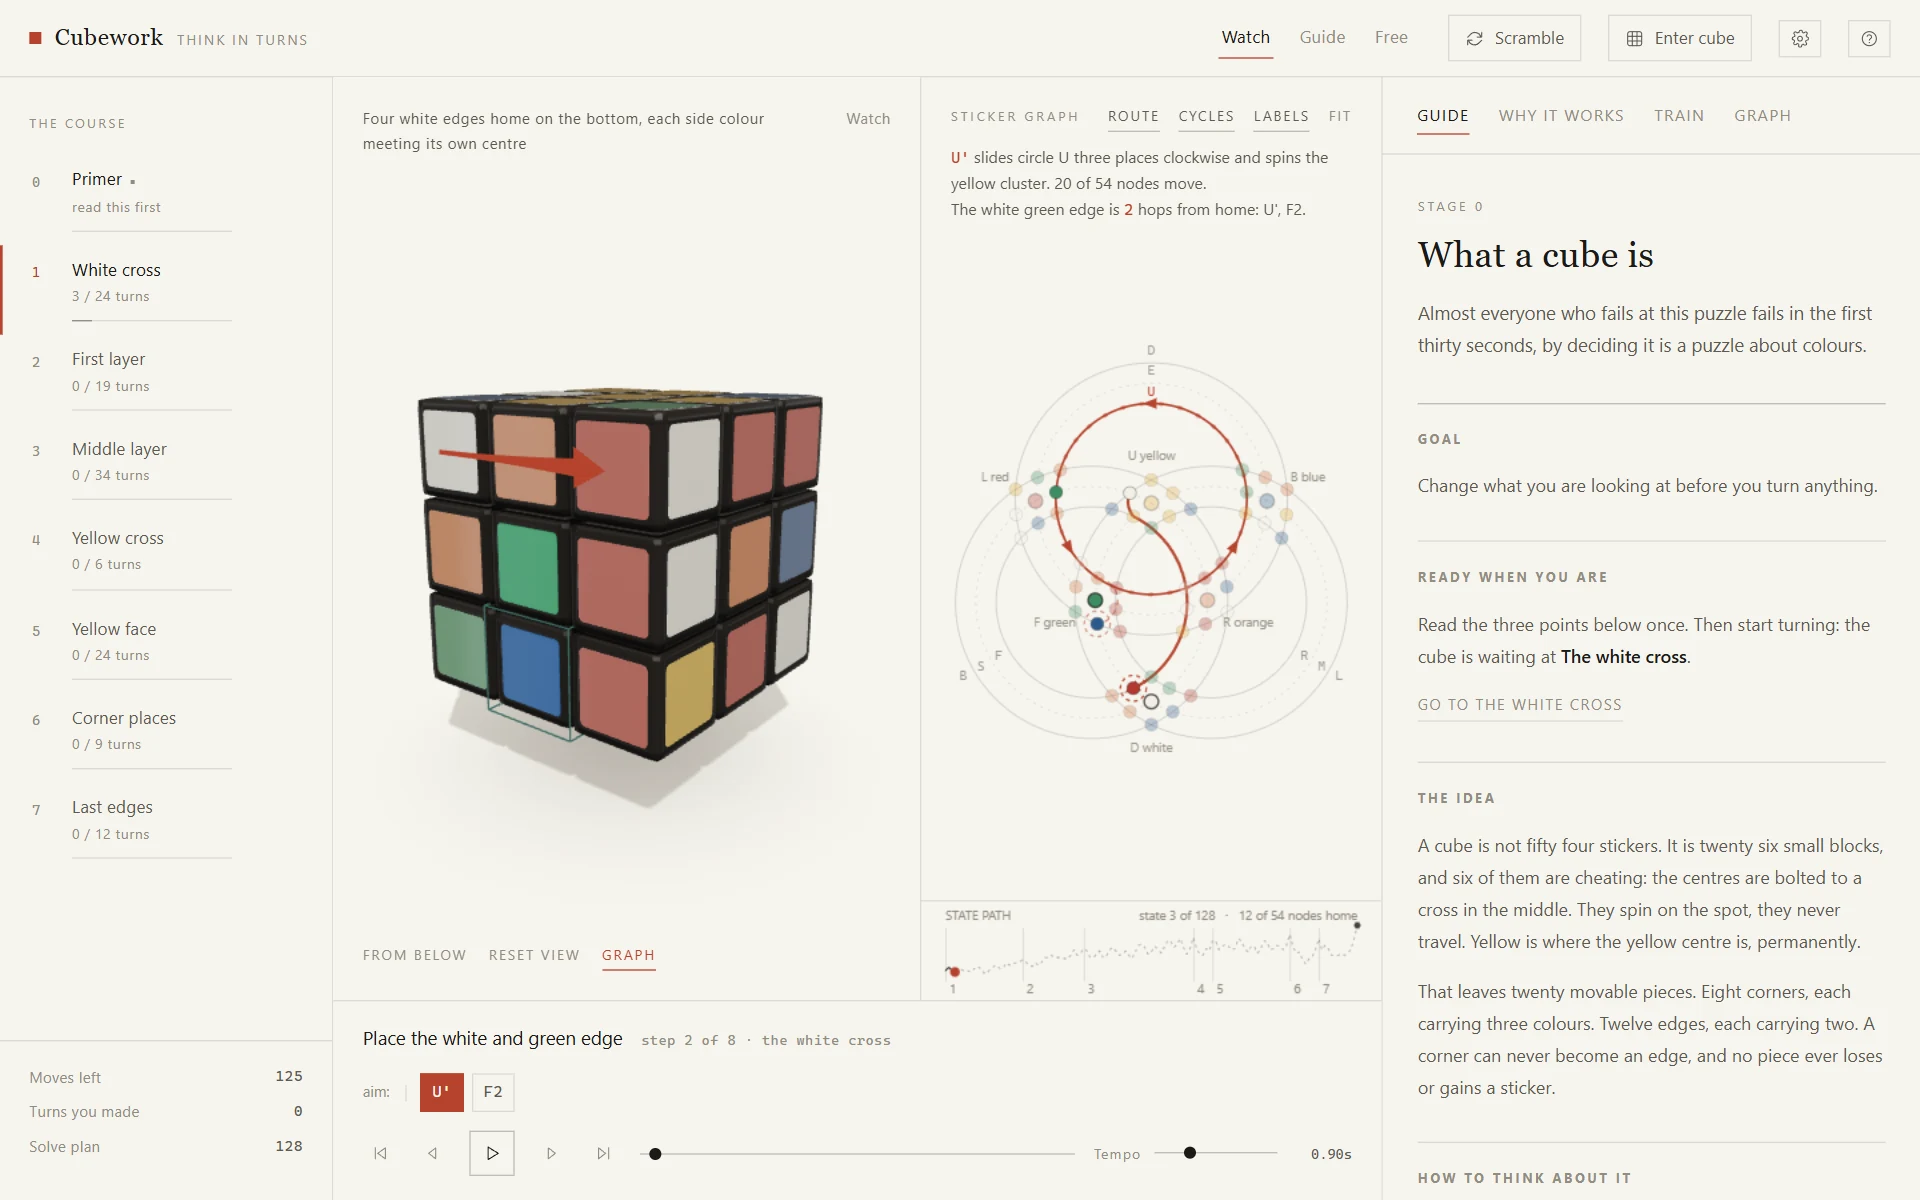
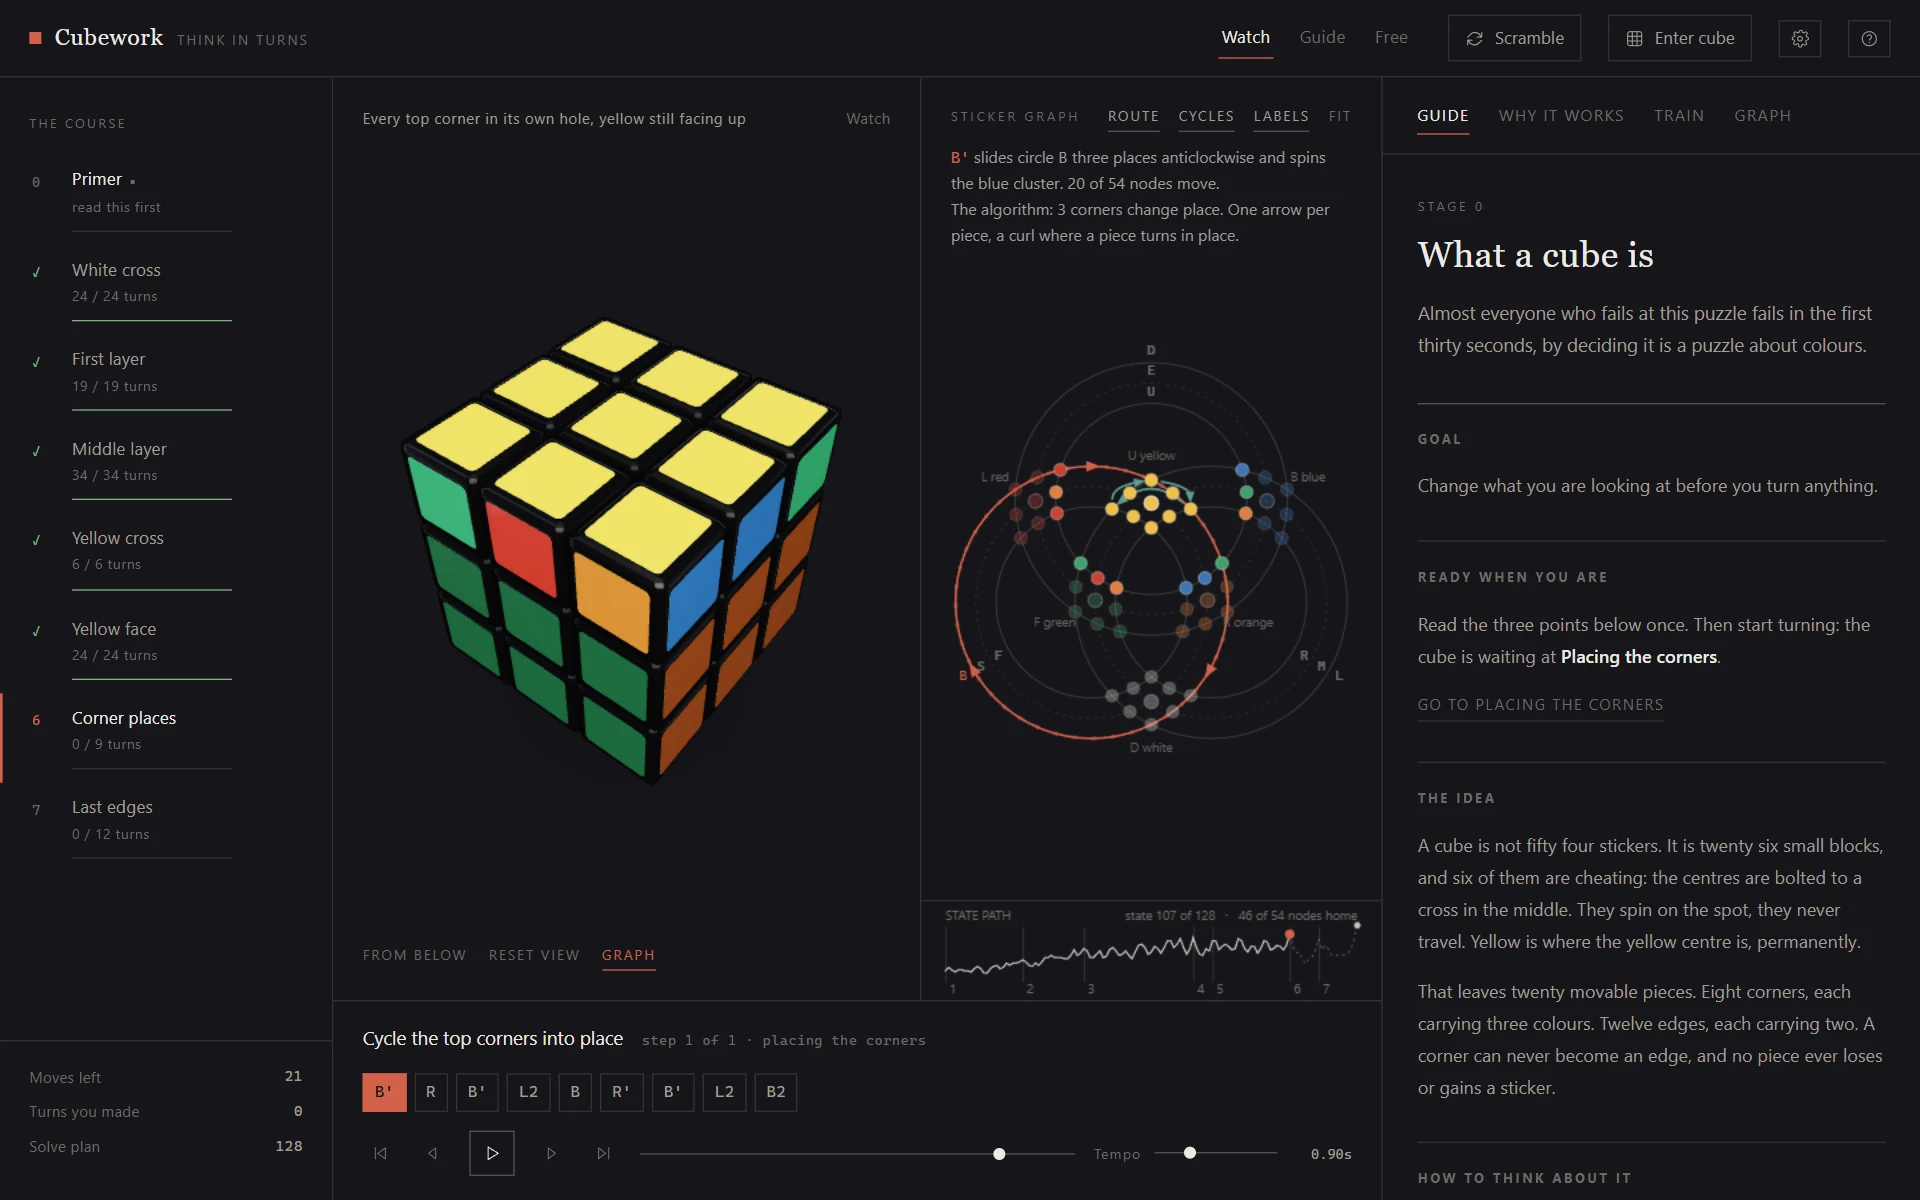
A computer solves a puzzle cube in twenty turns, and nobody can learn anything from those twenty turns. Cubework goes the other way. It plans a beginner layer by layer solve, explains every stage through the thinking move it trains, and shows two graphs while it does: one in which every sticker is a point and every layer a circle, and one in which every position of the cube is a point and the solve is a path.
A solver that shows its reasons
Cubework takes a scrambled cube, or the one you are holding, and plans the solve by the layer method: first the white cross, then the white corners, the middle layer and finally the yellow face in four steps.
Every step is chosen from the repertoire a learner has already seen. The solver simulates the known algorithms and keeps the first that reaches the sub goal without undoing finished work. The result is longer than an optimal solution, and that is the point: every turn has a reason you can read.
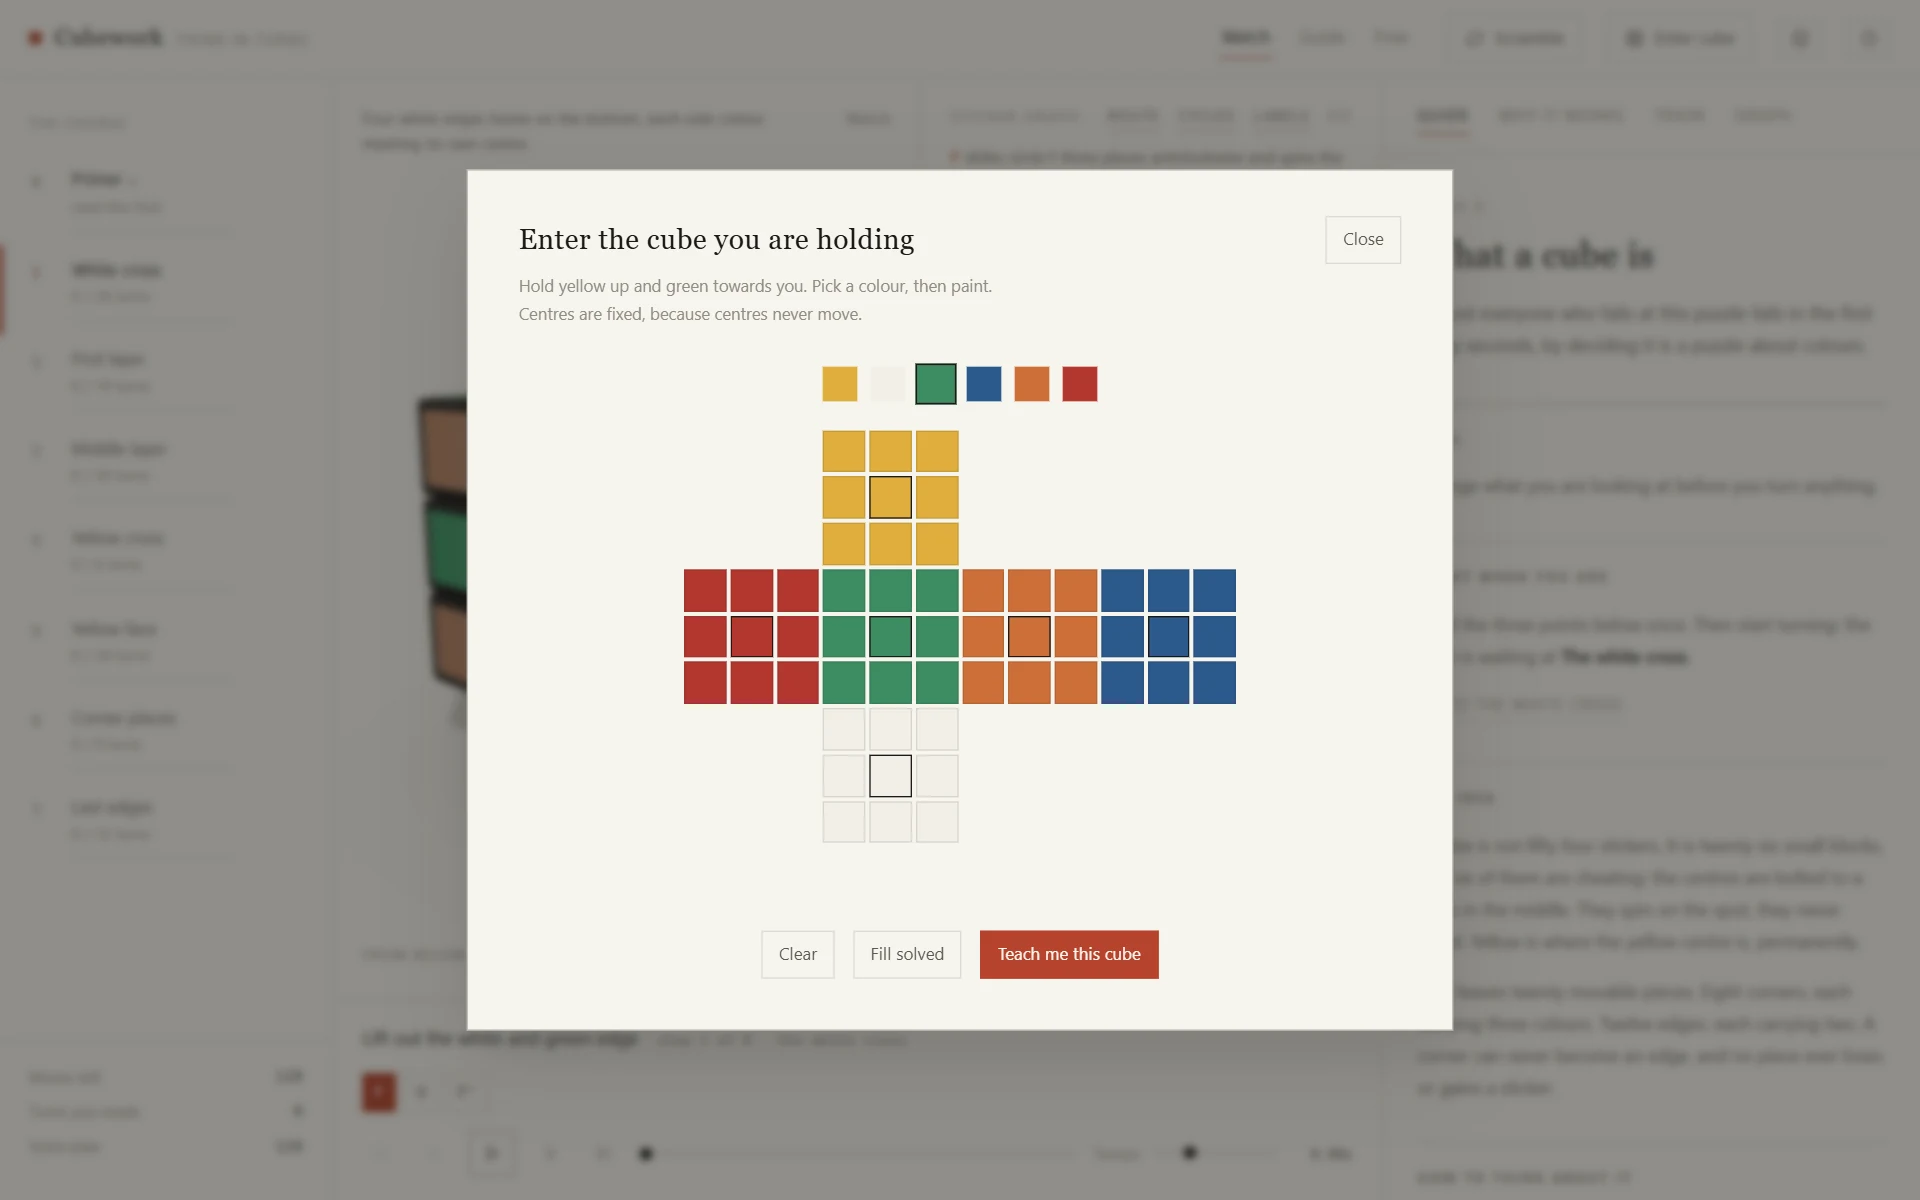
Three modes: Watch; Guide, where you make every turn yourself and the app checks it; and Free, where you turn anything and the plan is recomputed after each move.
The curriculum
Seven stages, seven thinking moves
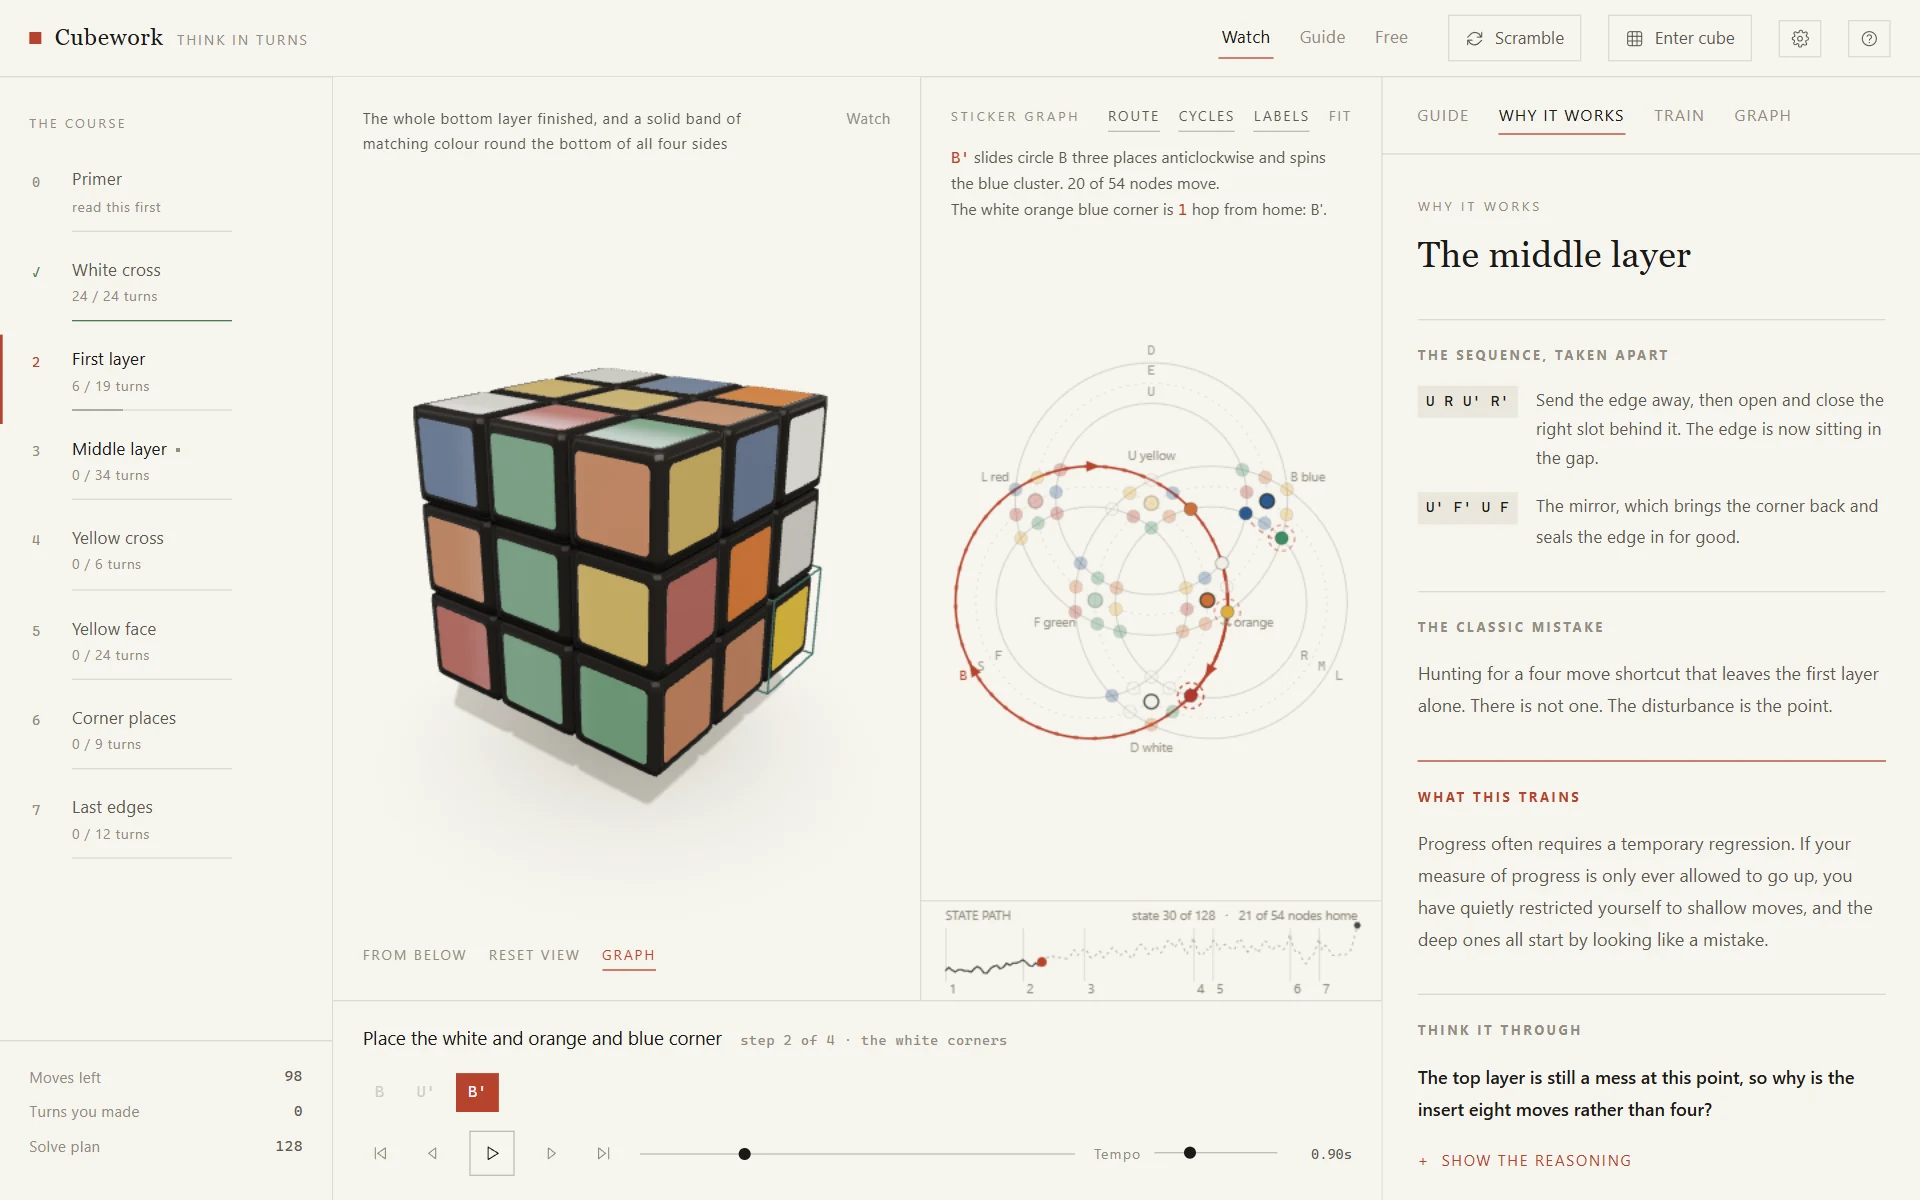
- 01 The white cross Slack is a resource with an expiry date. Early on, ugly moves are cheap; later they are not.
- 02 The white corners Setup, act, undo. What is impossible here gets carried to where it is possible, and back.
- 03 The middle layer Progress often needs a temporary regression. If progress may only ever go up, only shallow moves remain.
- 04 The yellow cross Abstraction means discarding everything that cannot change the next decision.
- 05 Yellow corners facing up Entangled variables are solved in sequence, with moves that touch one and leave the other alone.
- 06 Placing the corners Knowing what is impossible prunes a search harder than any heuristic. Invariants are the cheapest intelligence there is.
- 07 The last edges Degrees of freedom drain. Front load the expensive, constraining decisions and the endgame becomes bookkeeping.
The cube turns, the graph slides with it
Graph one
Stickers as points, layers as circles
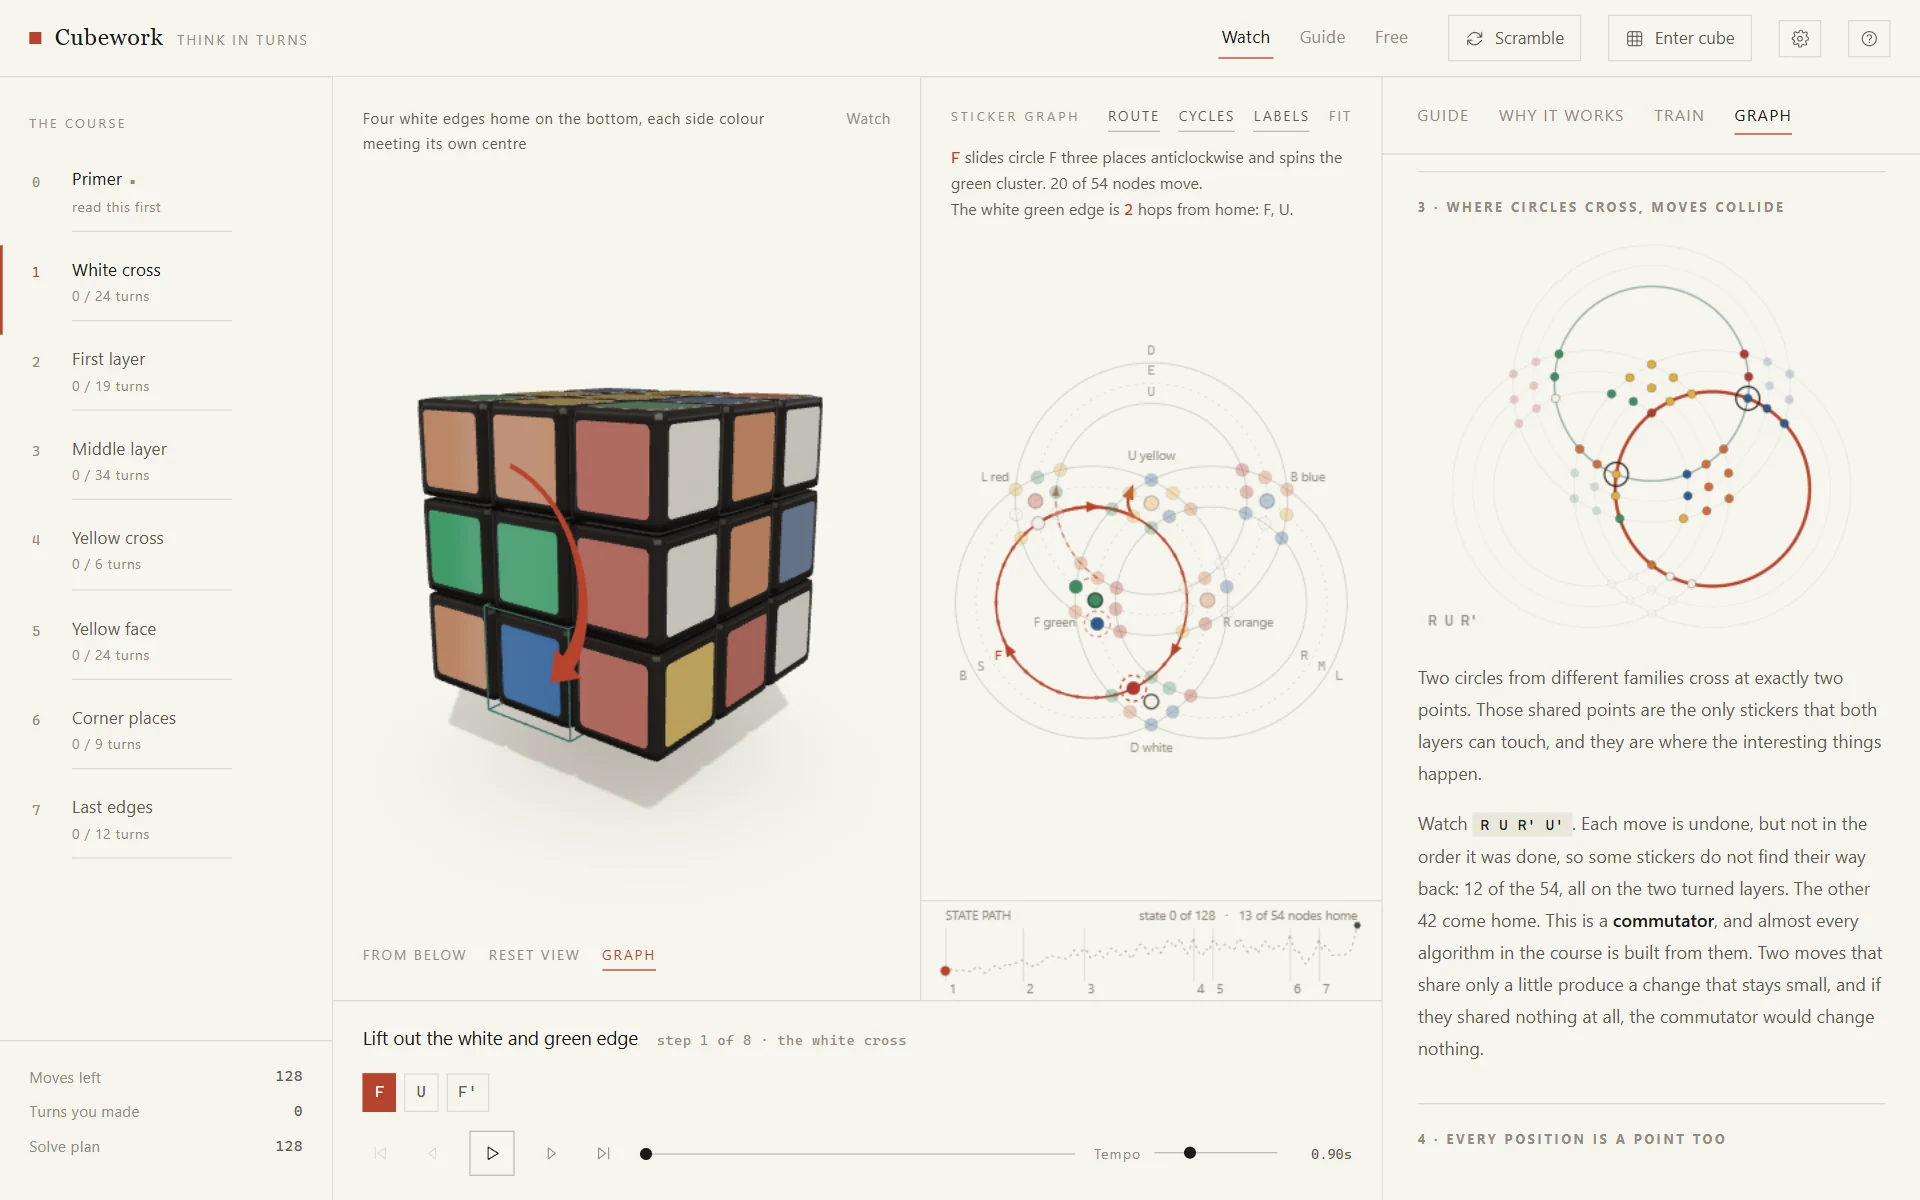
Take the 54 stickers off the cube and draw, for each layer, a circle through the twelve stickers it carries sideways. You get nine circles in three families, one per axis. Every point sits where two circles of different families cross. A quarter turn then moves exactly one circle three places along and spins the nine points of the turned face about their centre.
The representation circulates in the cubing community. Not every arrangement of the circles agrees with the cube, though: of 384 variants checked, 96 carry the points round in the same order as the real cube. Cubework uses one of them, with the three faces of the default view on the inside.
The graph keeps no state of its own. It reads the same cube position and the same turn angle as the 3D view, which is why both move together in every frame.
A turn that moves twenty stickers on the cube is a single sliding circle in the graph.
The route of a piece to its home
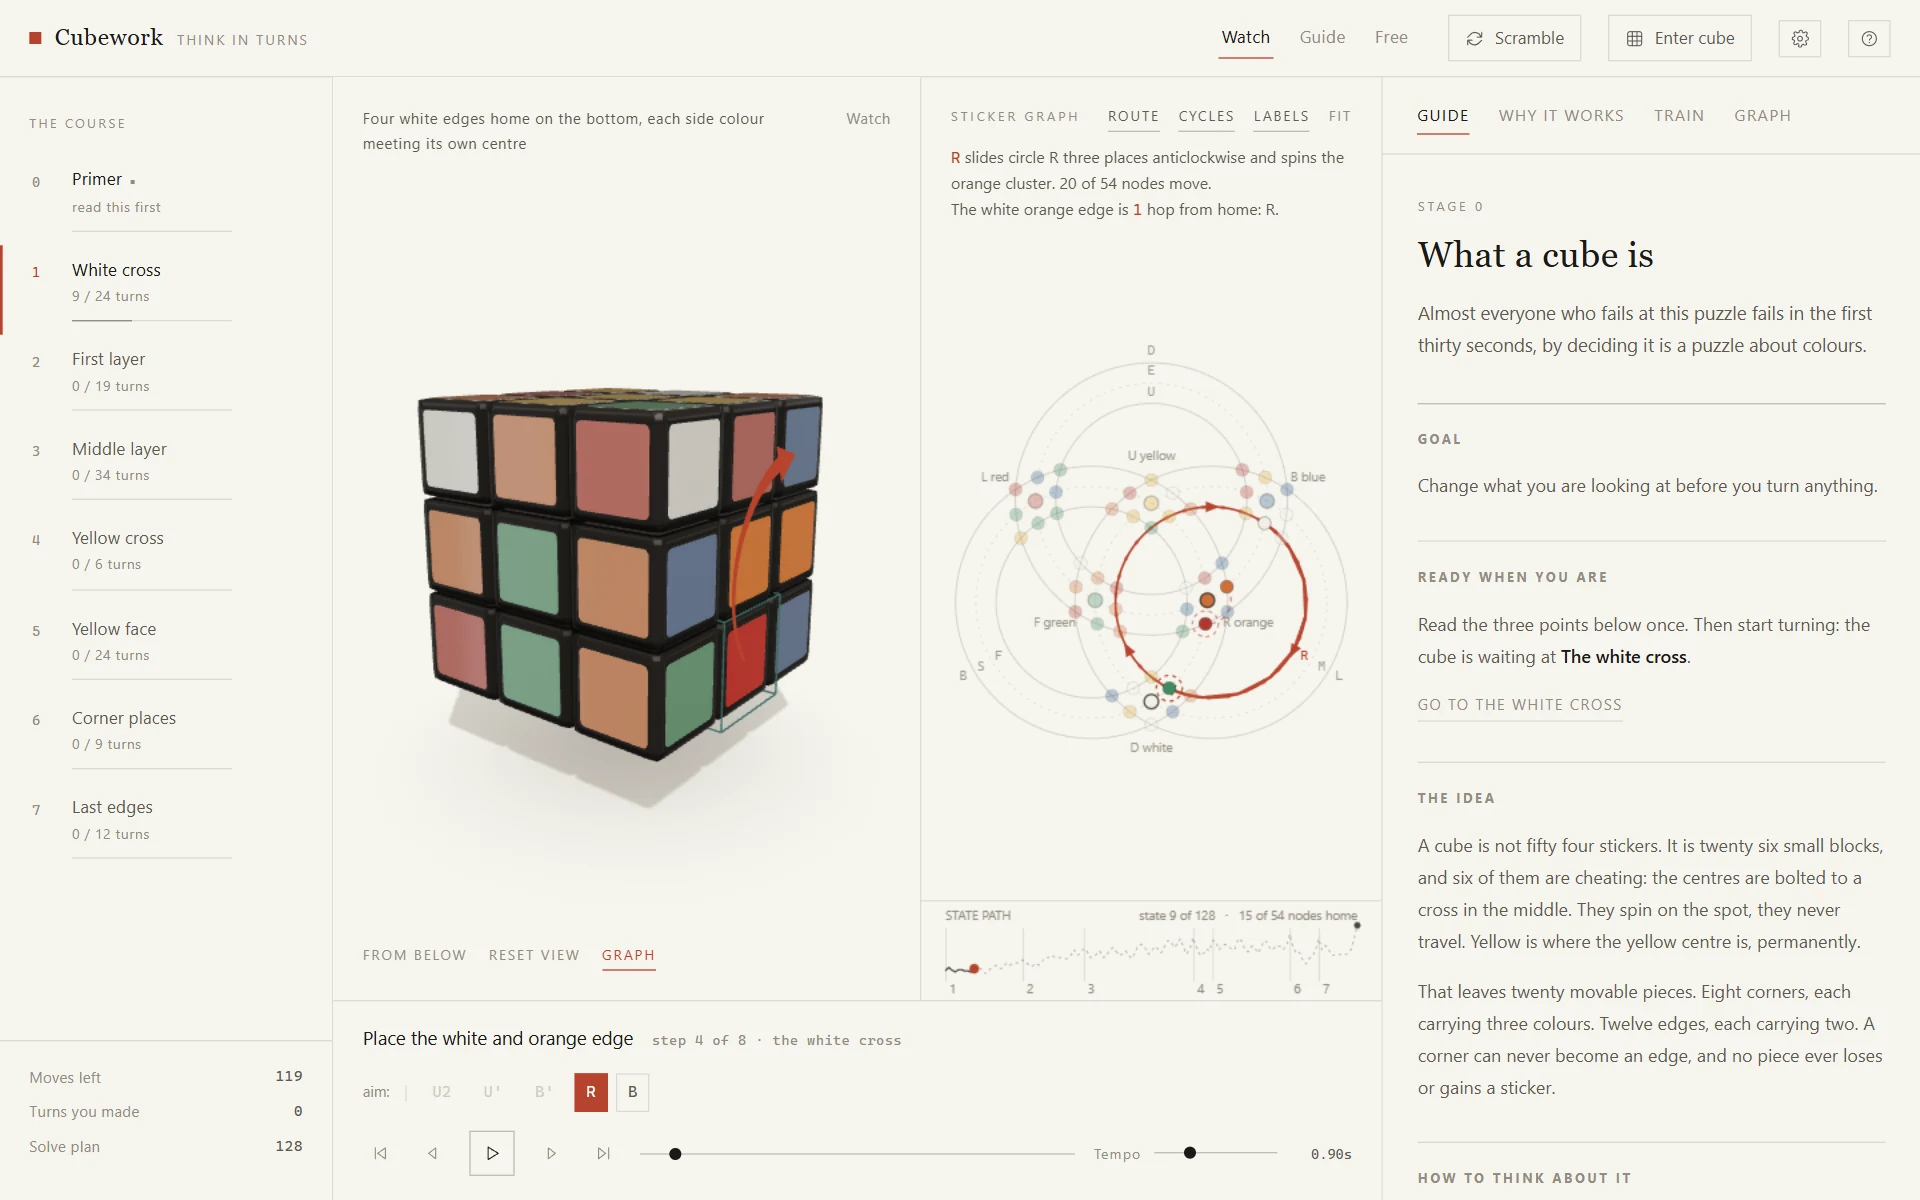
In the first three stages every step is about one named piece. The graph draws its stickers hop by hop along the circles the rest of the step will carry them, up to the dashed ring at their destination. Above it, the app states how many hops remain and through which turns.
The next turn appears as a flowing mark on its circle, pointing the way the points are about to slide.
Linked in both directions
What an algorithm actually does
One arrow per sticker
- A three corner cycle becomes nine crossing curves.
- The picture reshuffles after every turn, because it only shows the rest of the step.
- The aiming turn of the top layer buries the actual message.
One arrow per piece
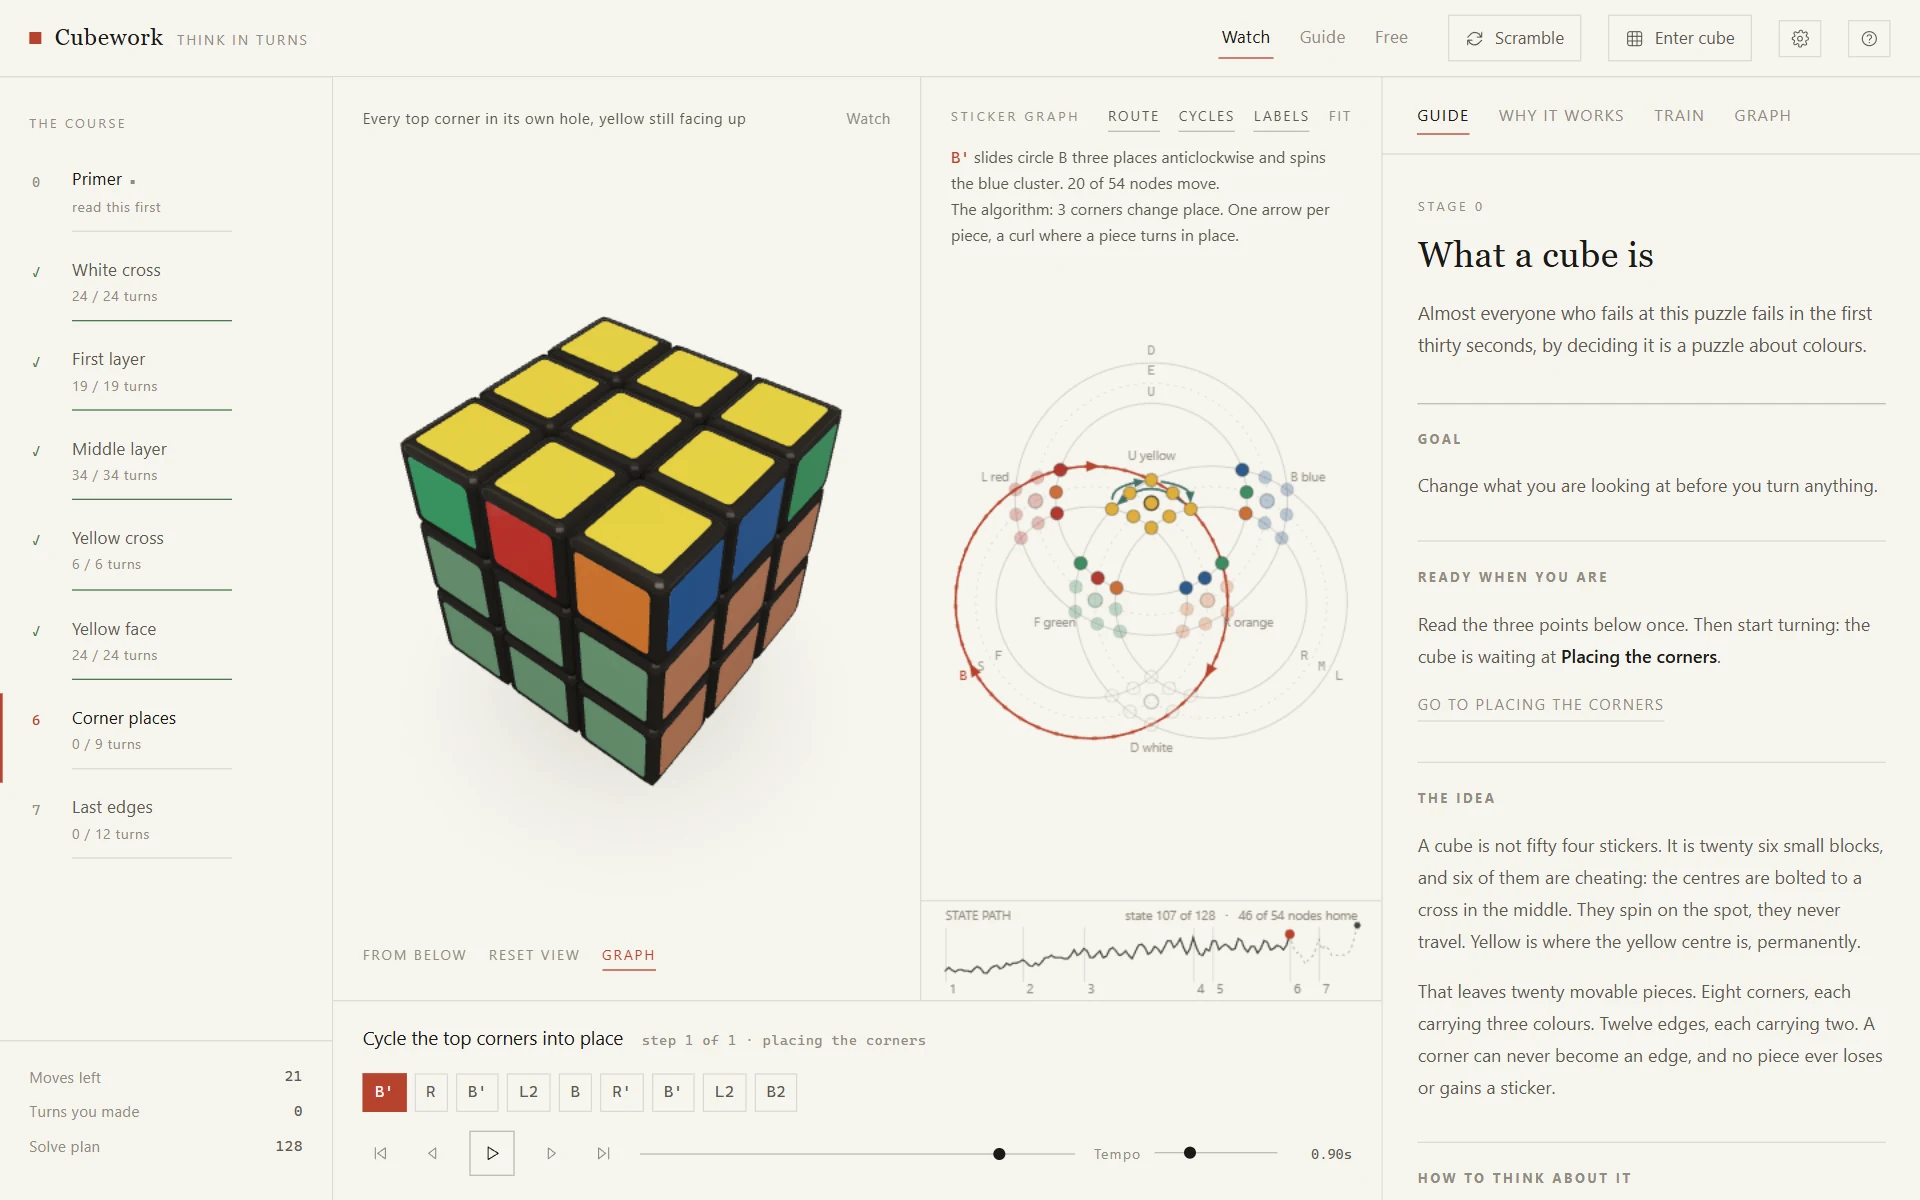
- Each piece appears at a fixed anchor point, so last layer algorithms read inside the yellow cluster.
- Smooth arcs bowing out of the cluster turn a cycle into a ring.
- The picture describes the whole algorithm and holds still while it runs. Pieces that only turn in place get a small curl.
A three corner cycle, read as arrows
Themes
One cube, seven rooms
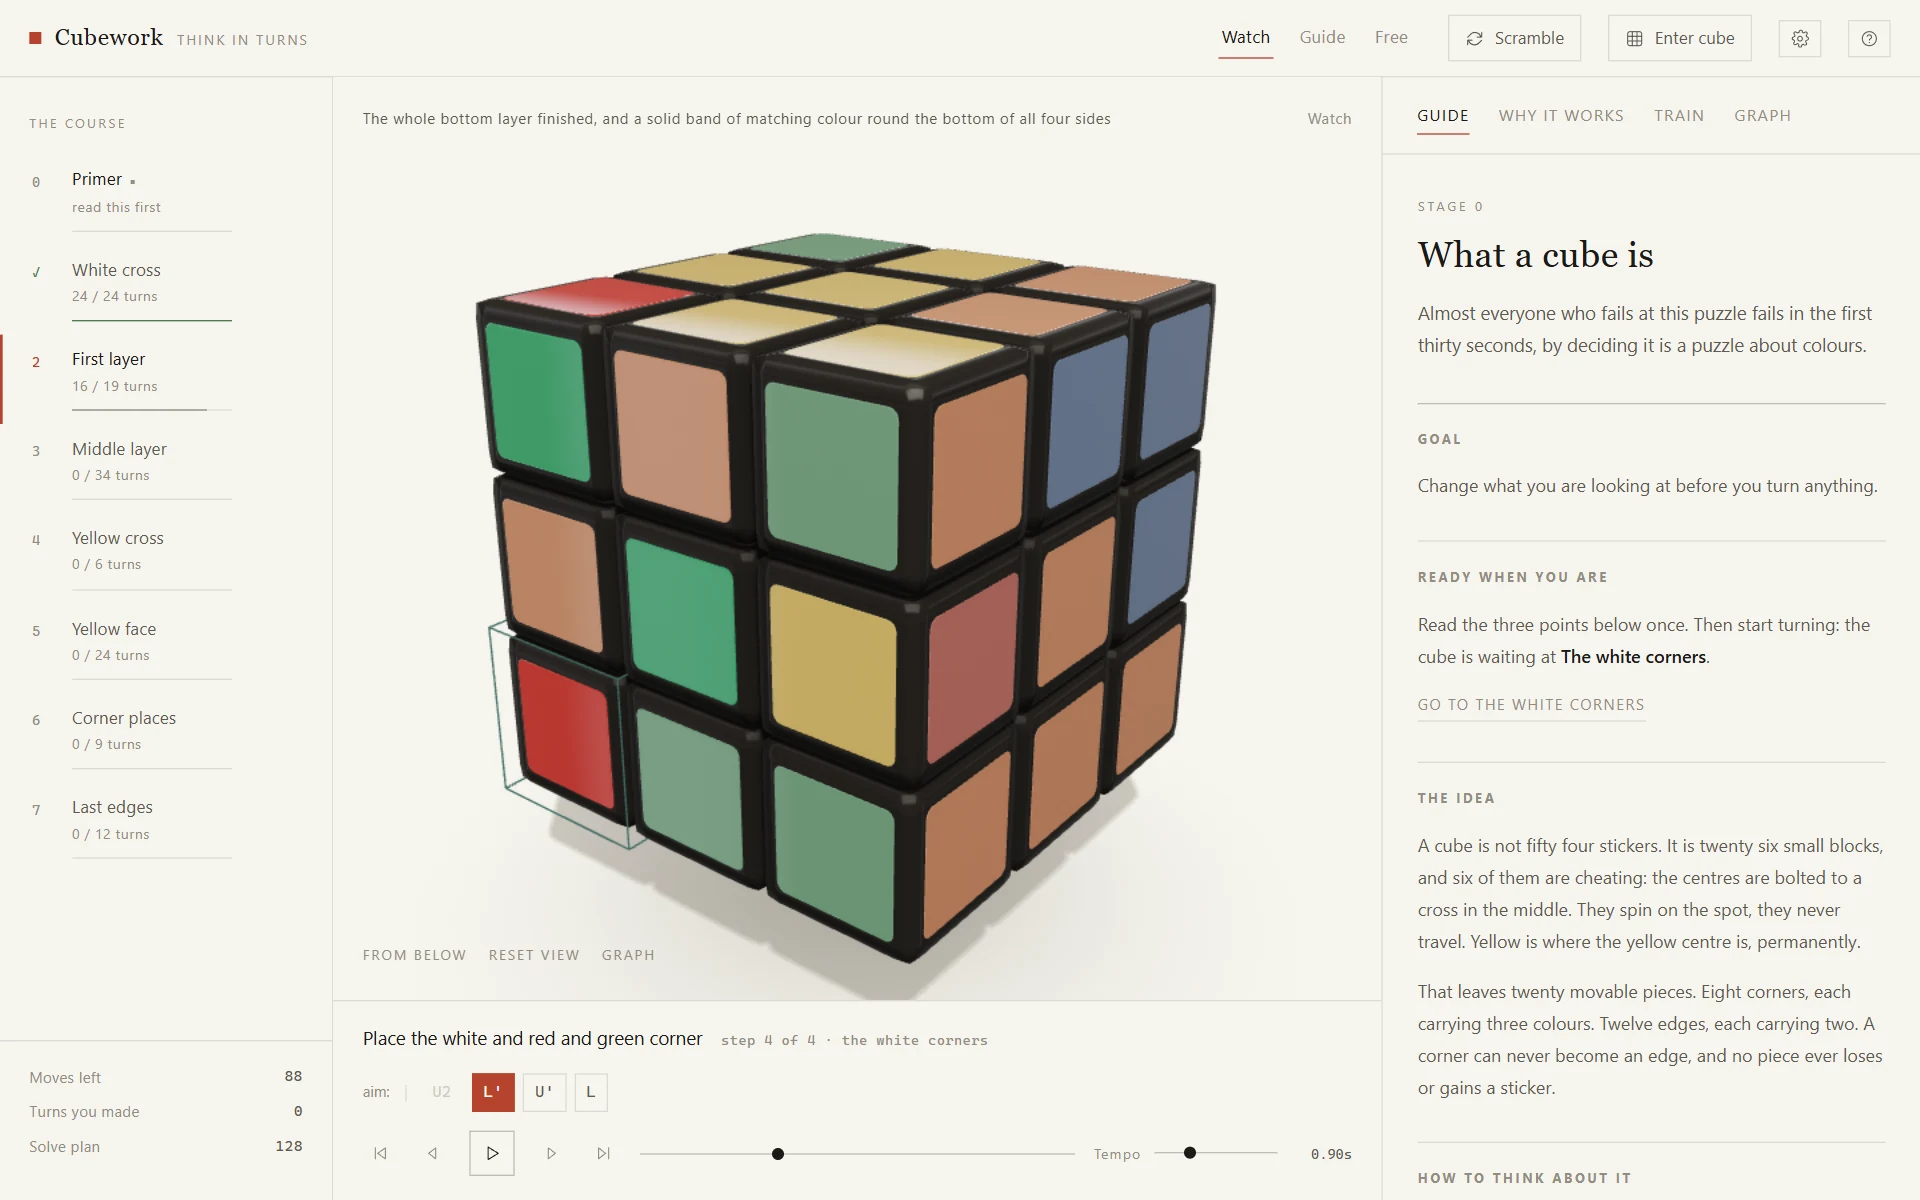
WashiThe default: paper, hairlines instead of boxes, a single accent.
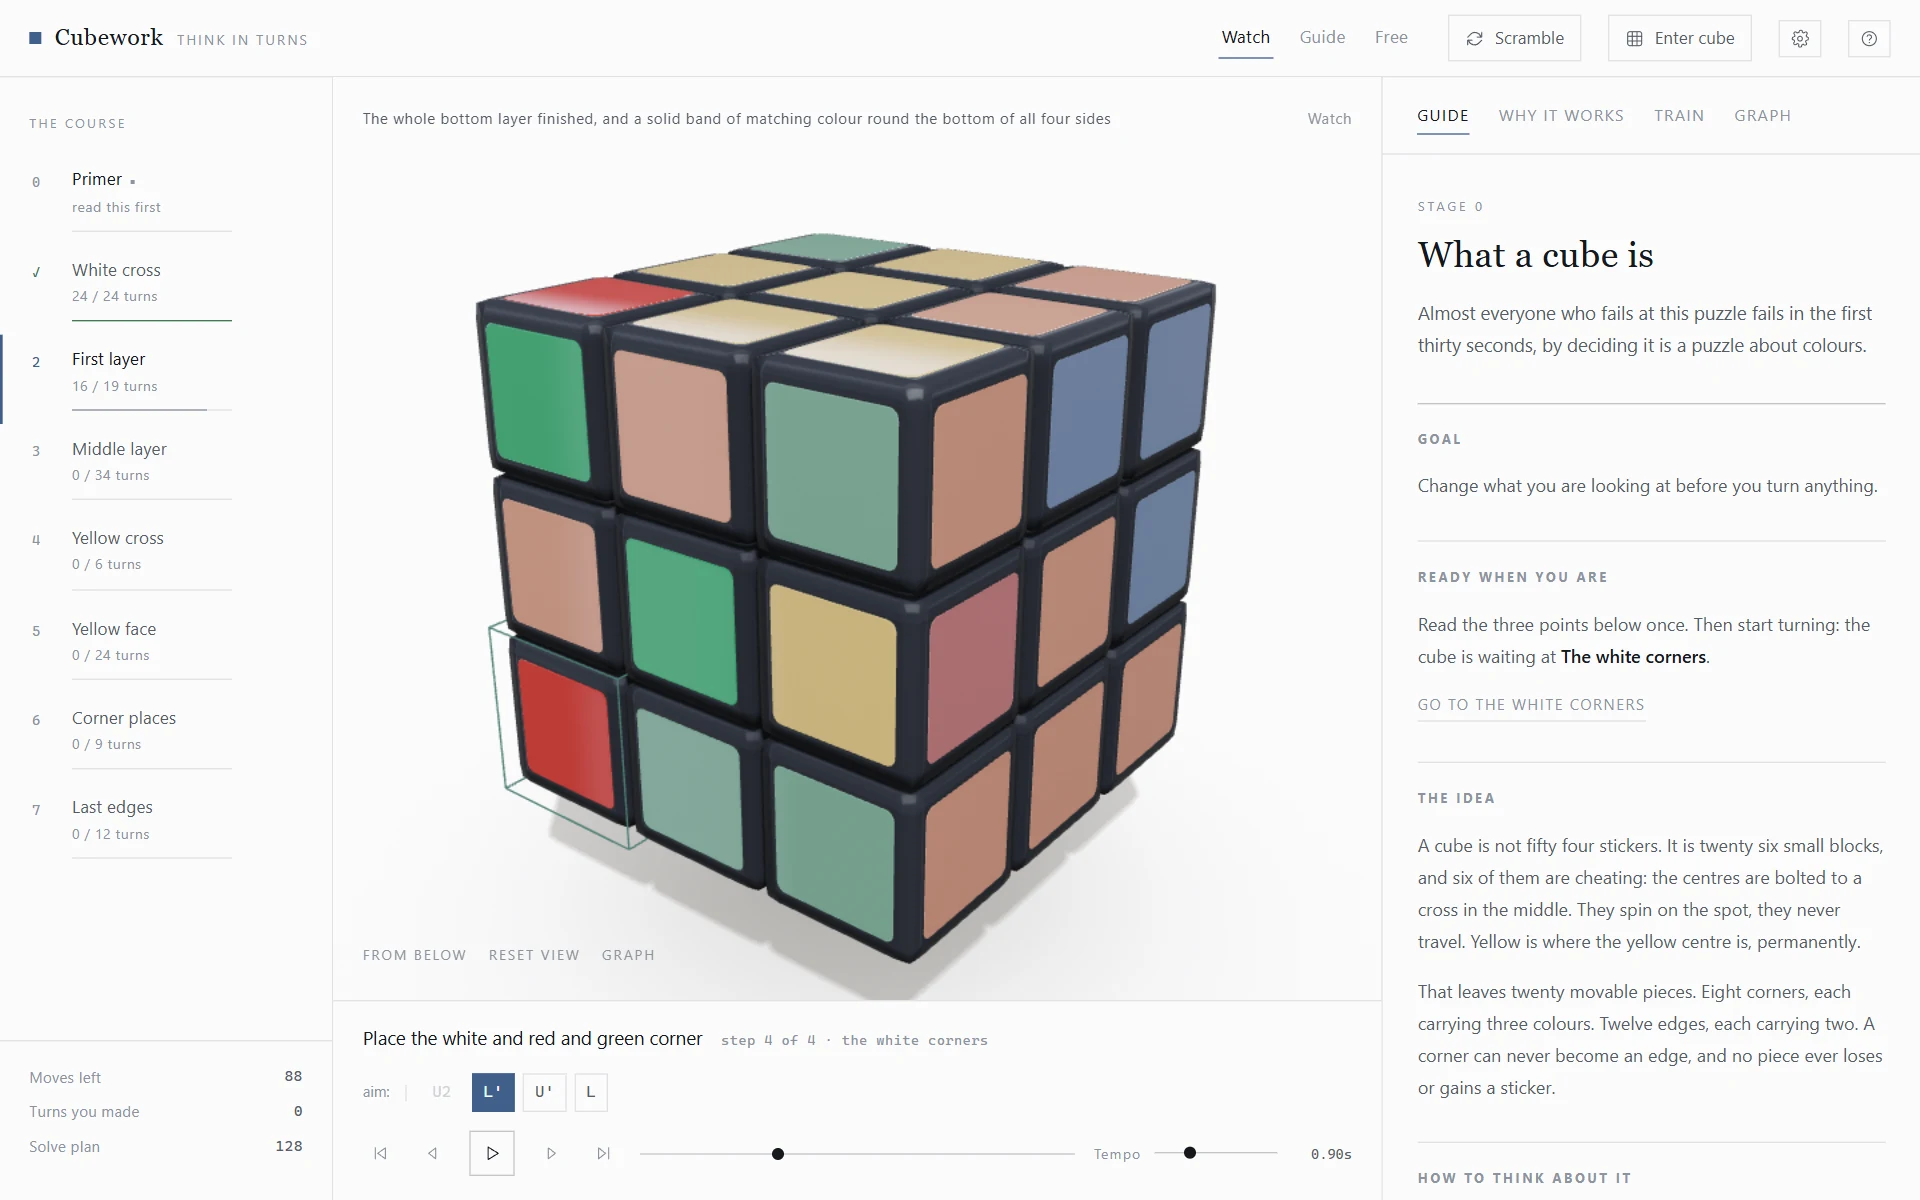
YukiCool white with a blue accent.
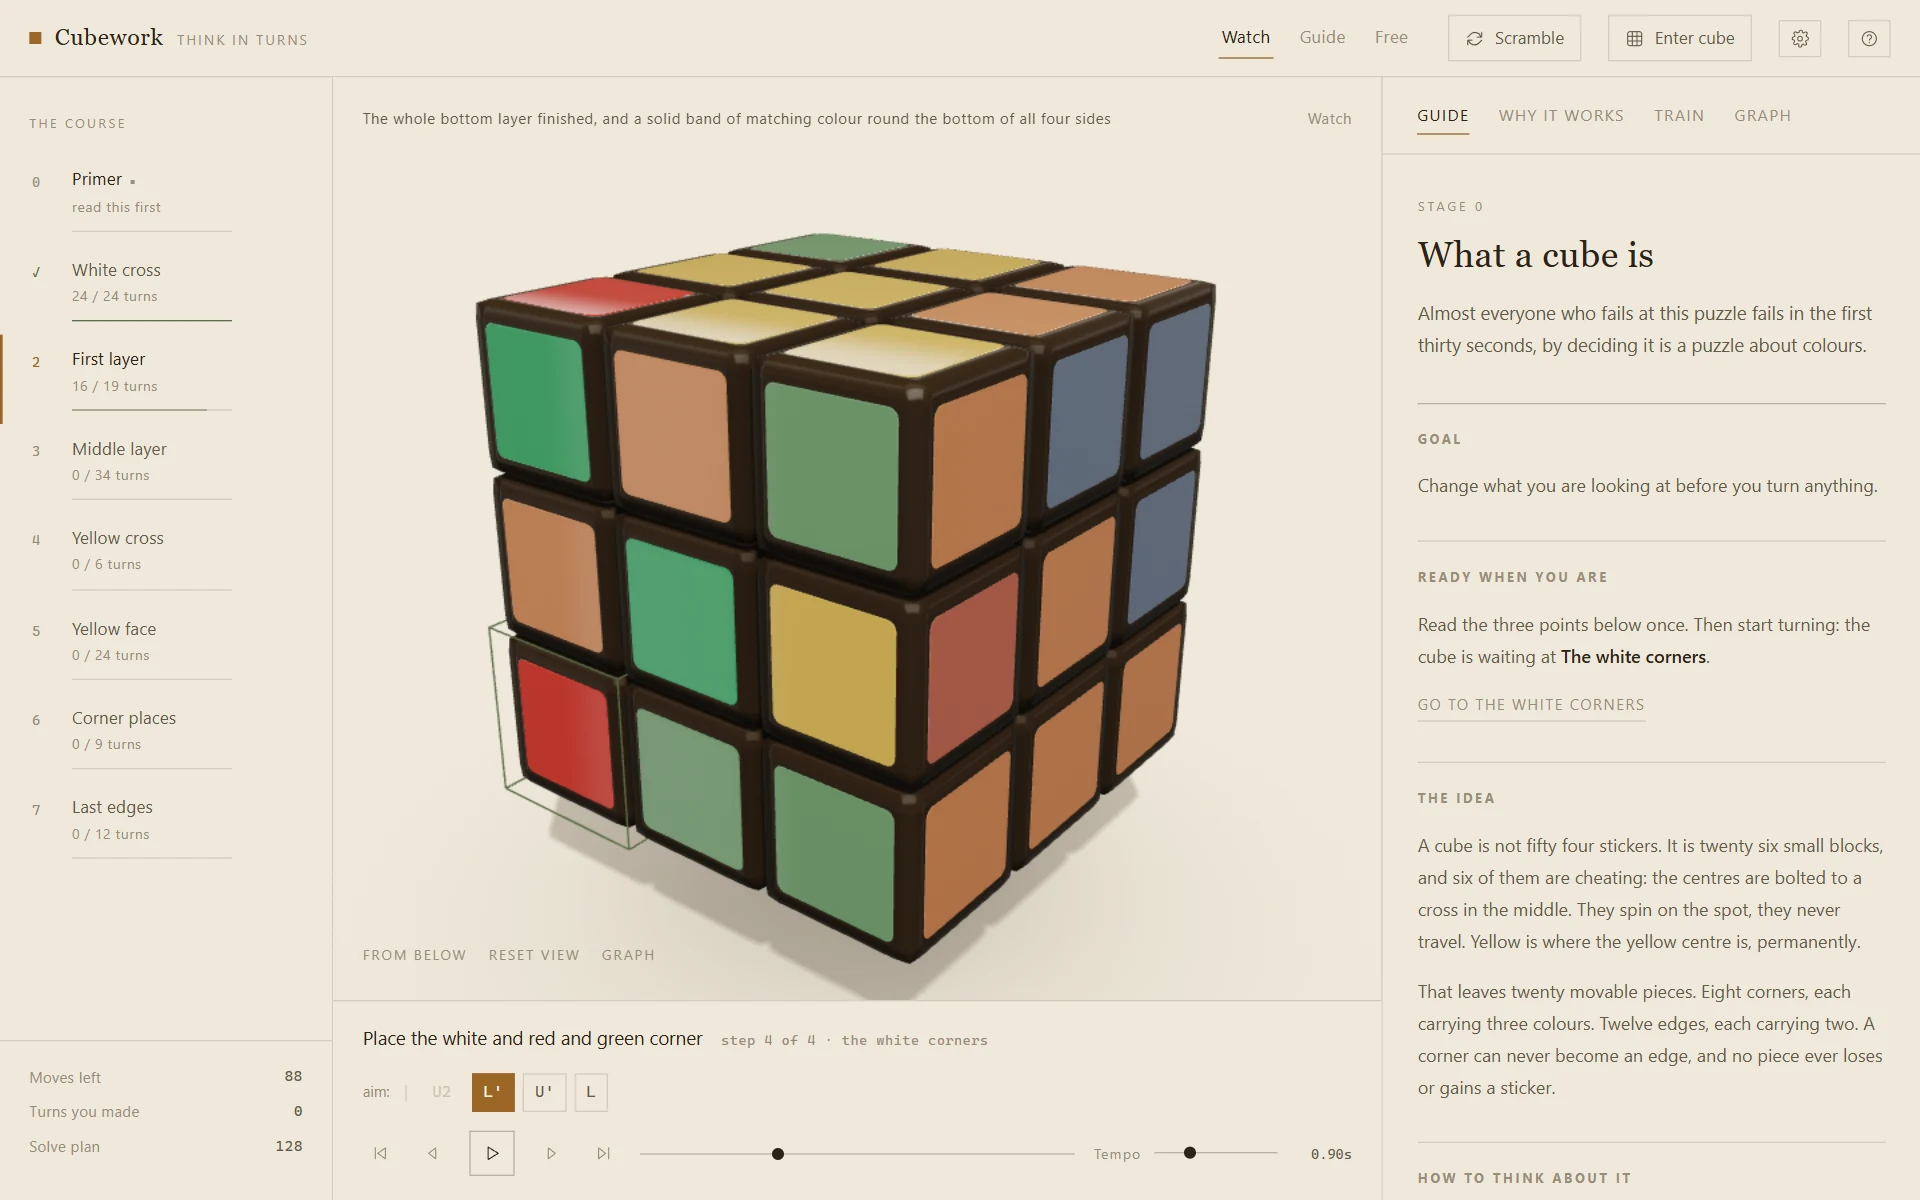
ChaTea coloured, with a warmer light on the cube.
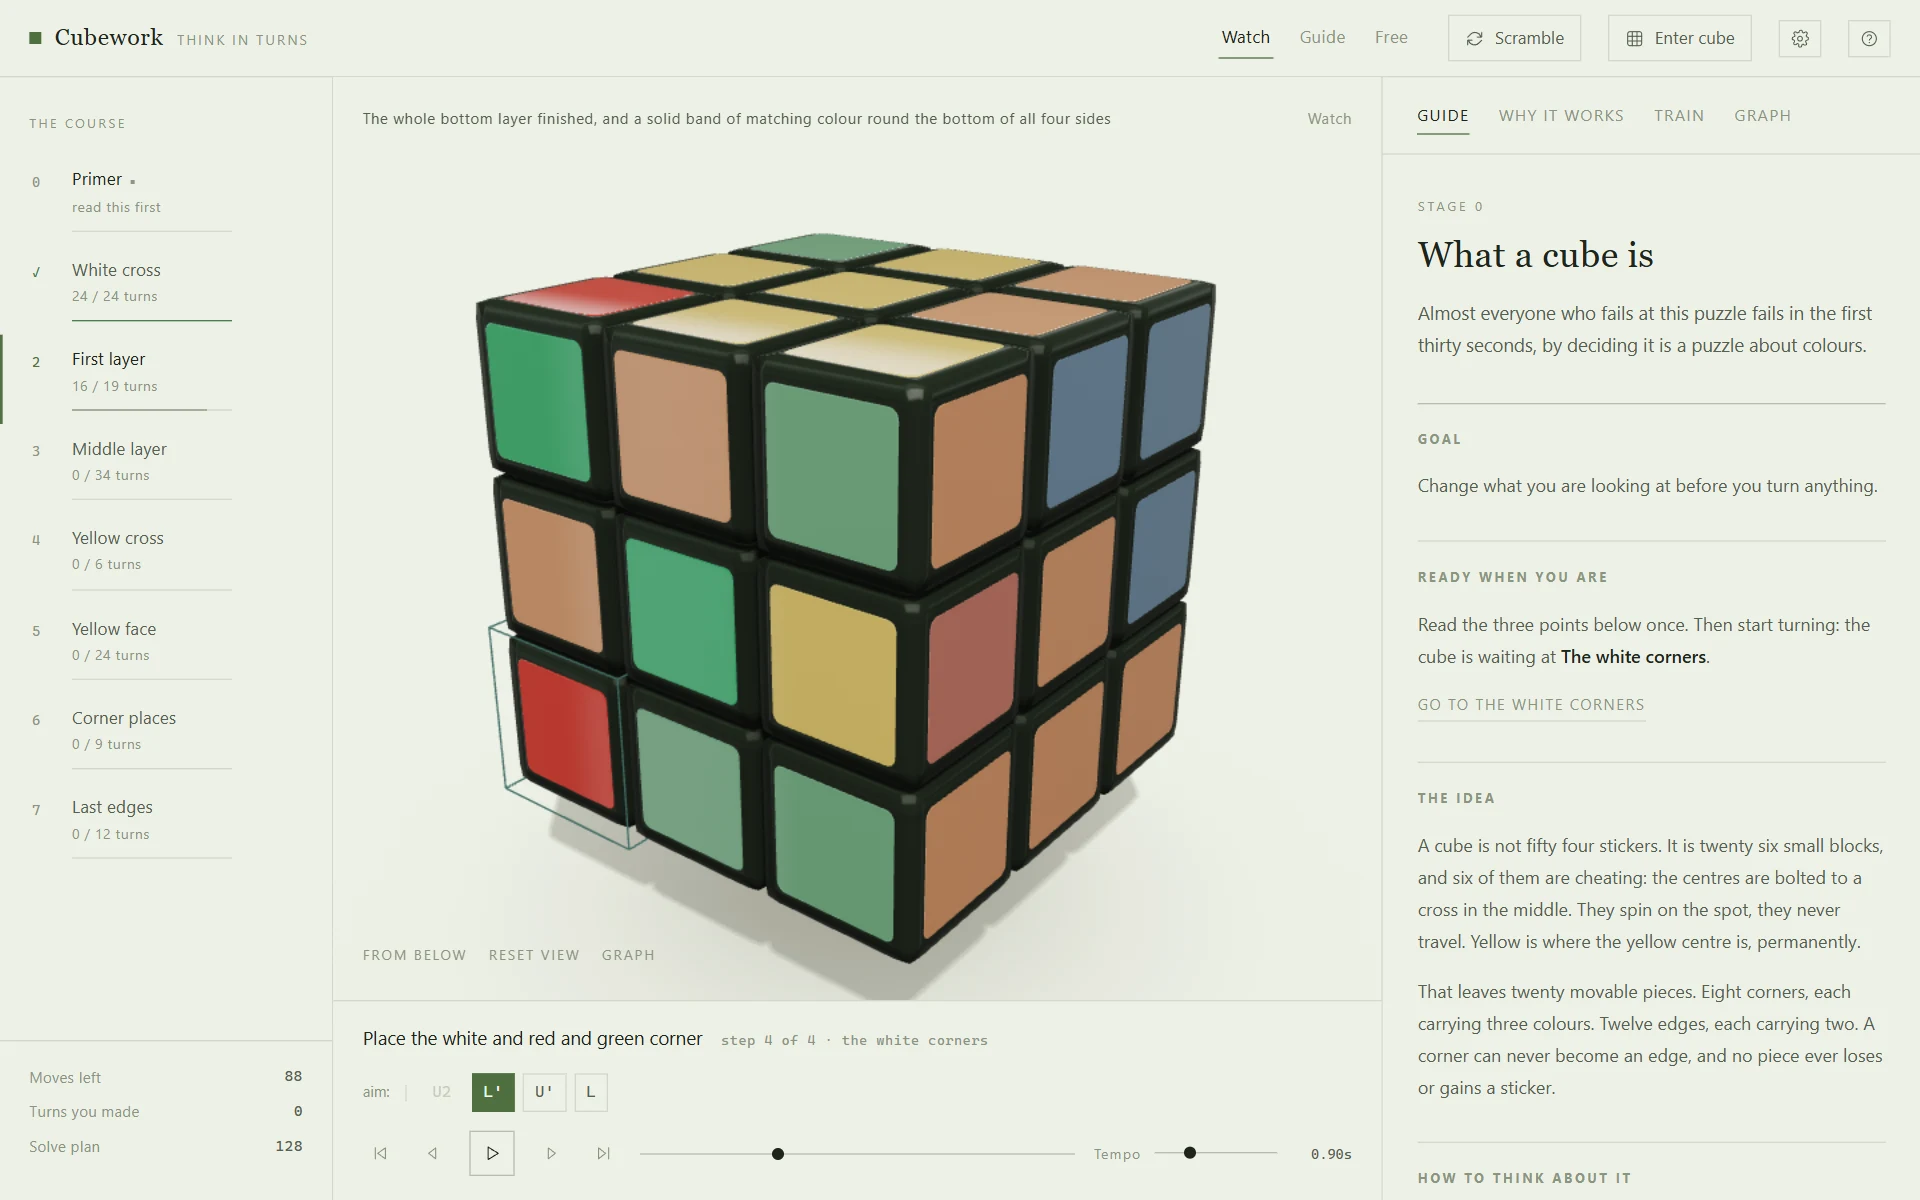
MatchaLeaf green, muted.
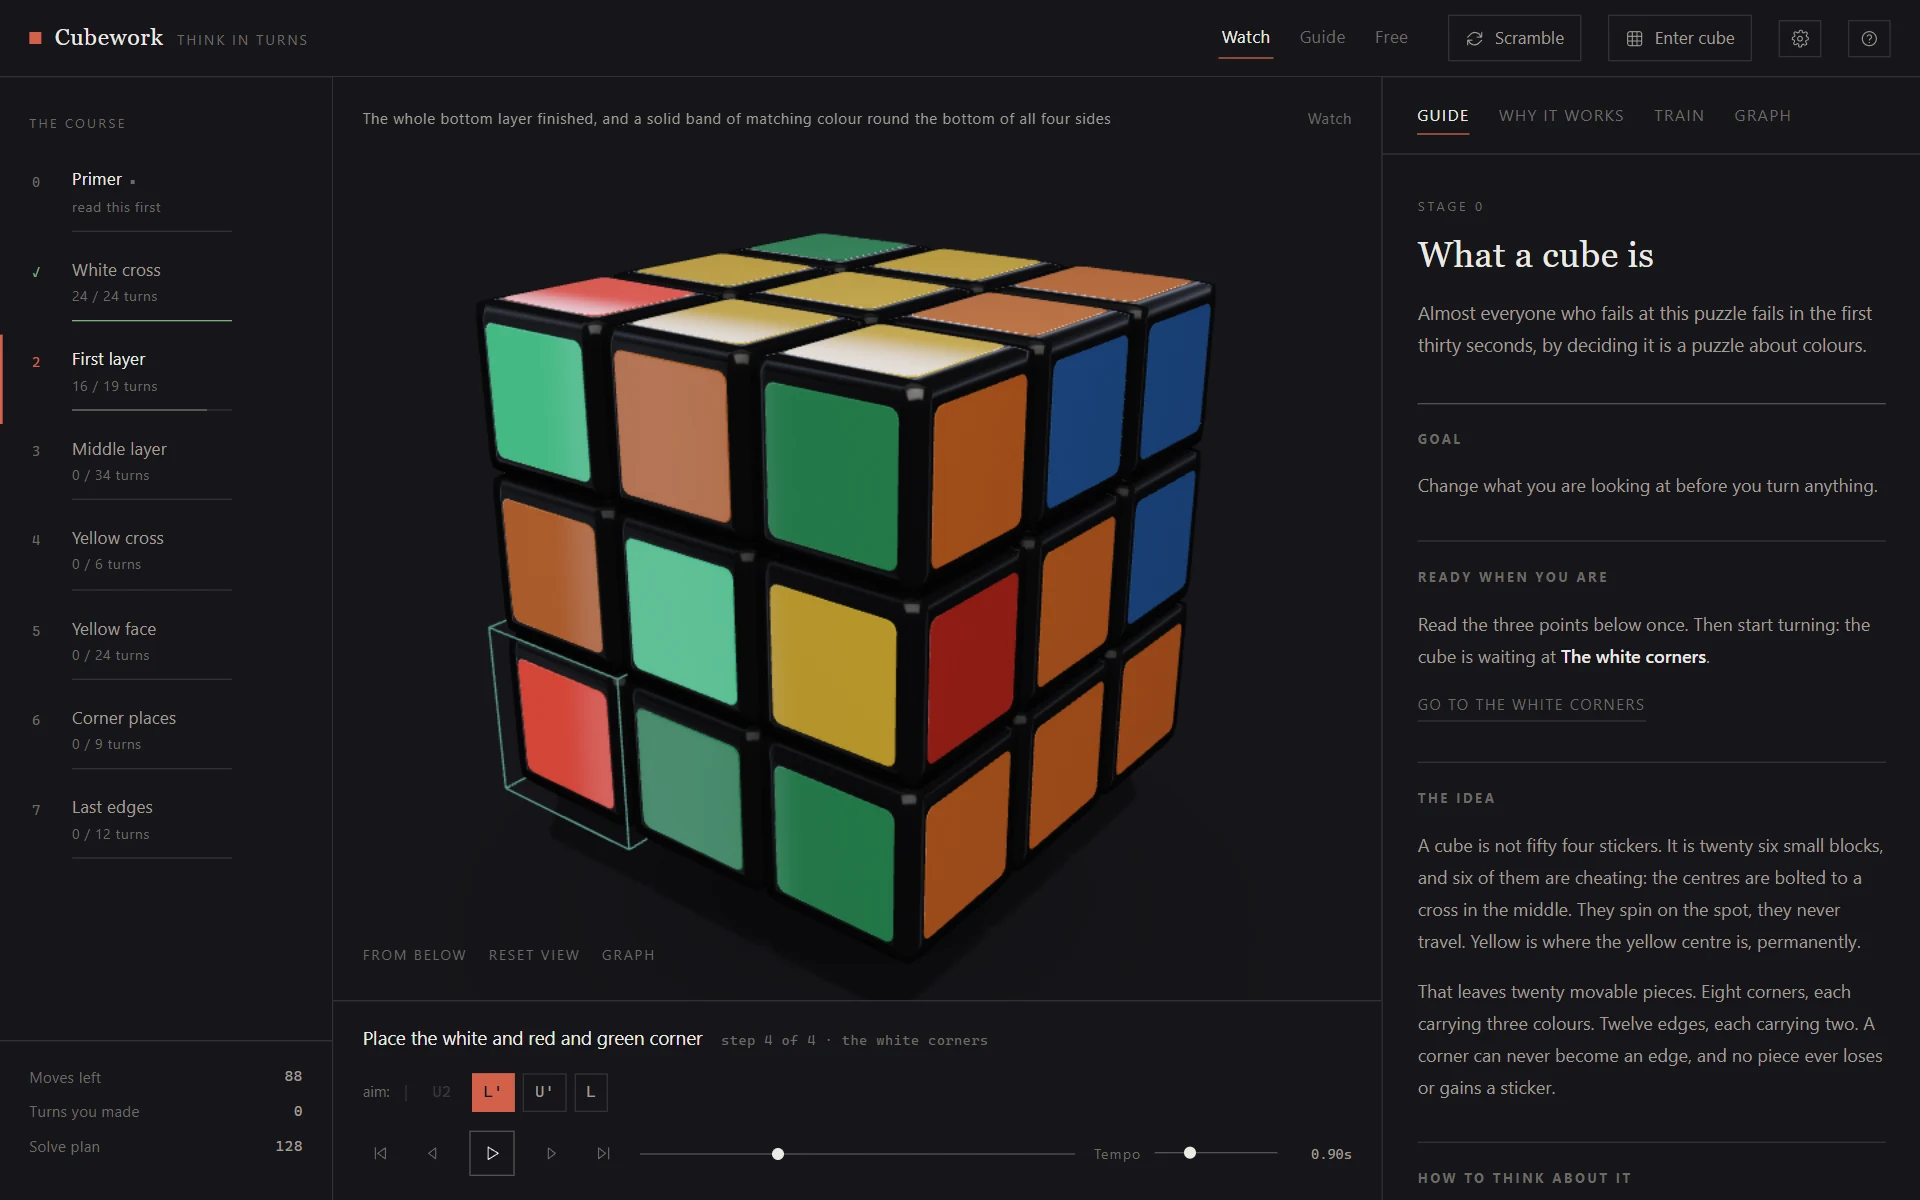
SumiInk: dark, with stronger tile colours and a brighter studio light.
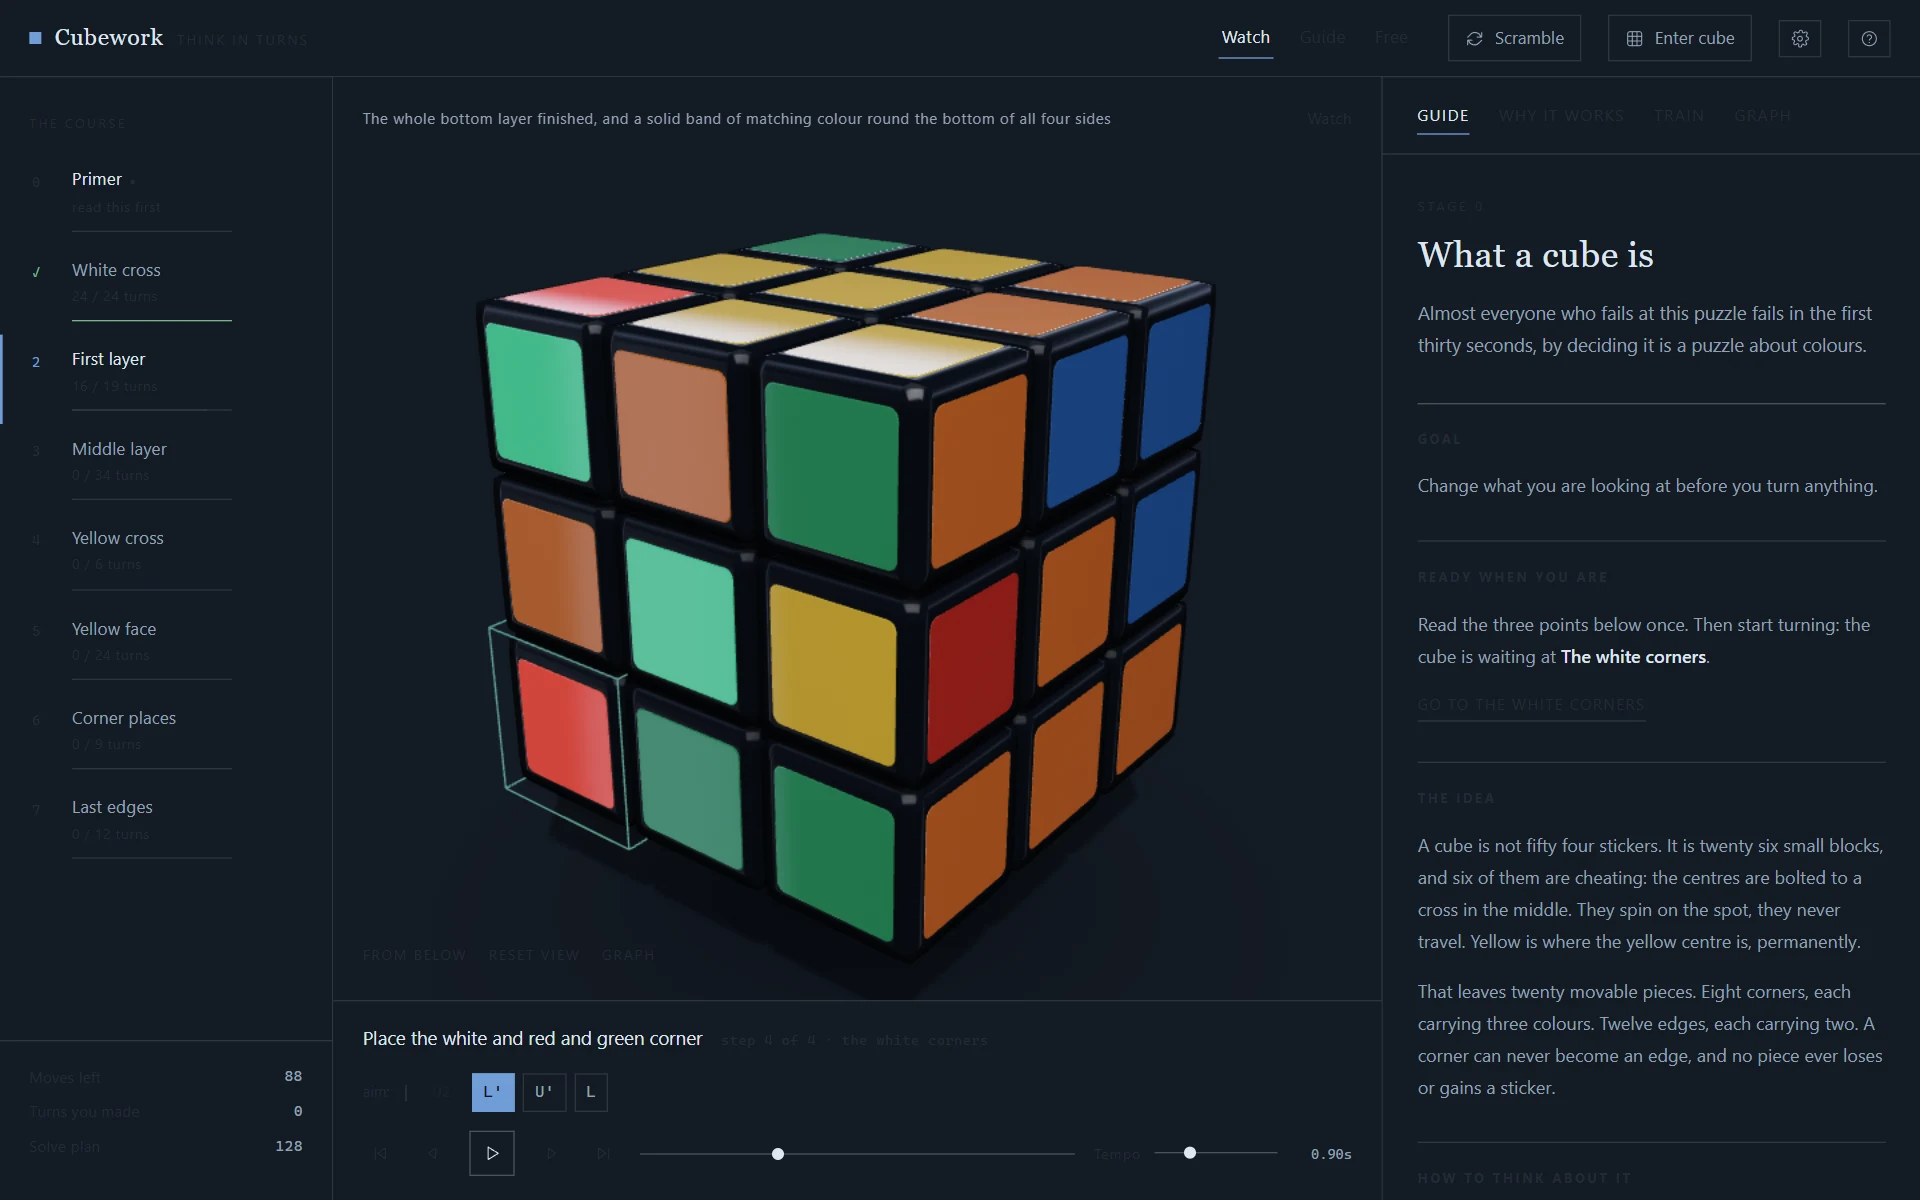
AiIndigo, the coolest of the dark themes.
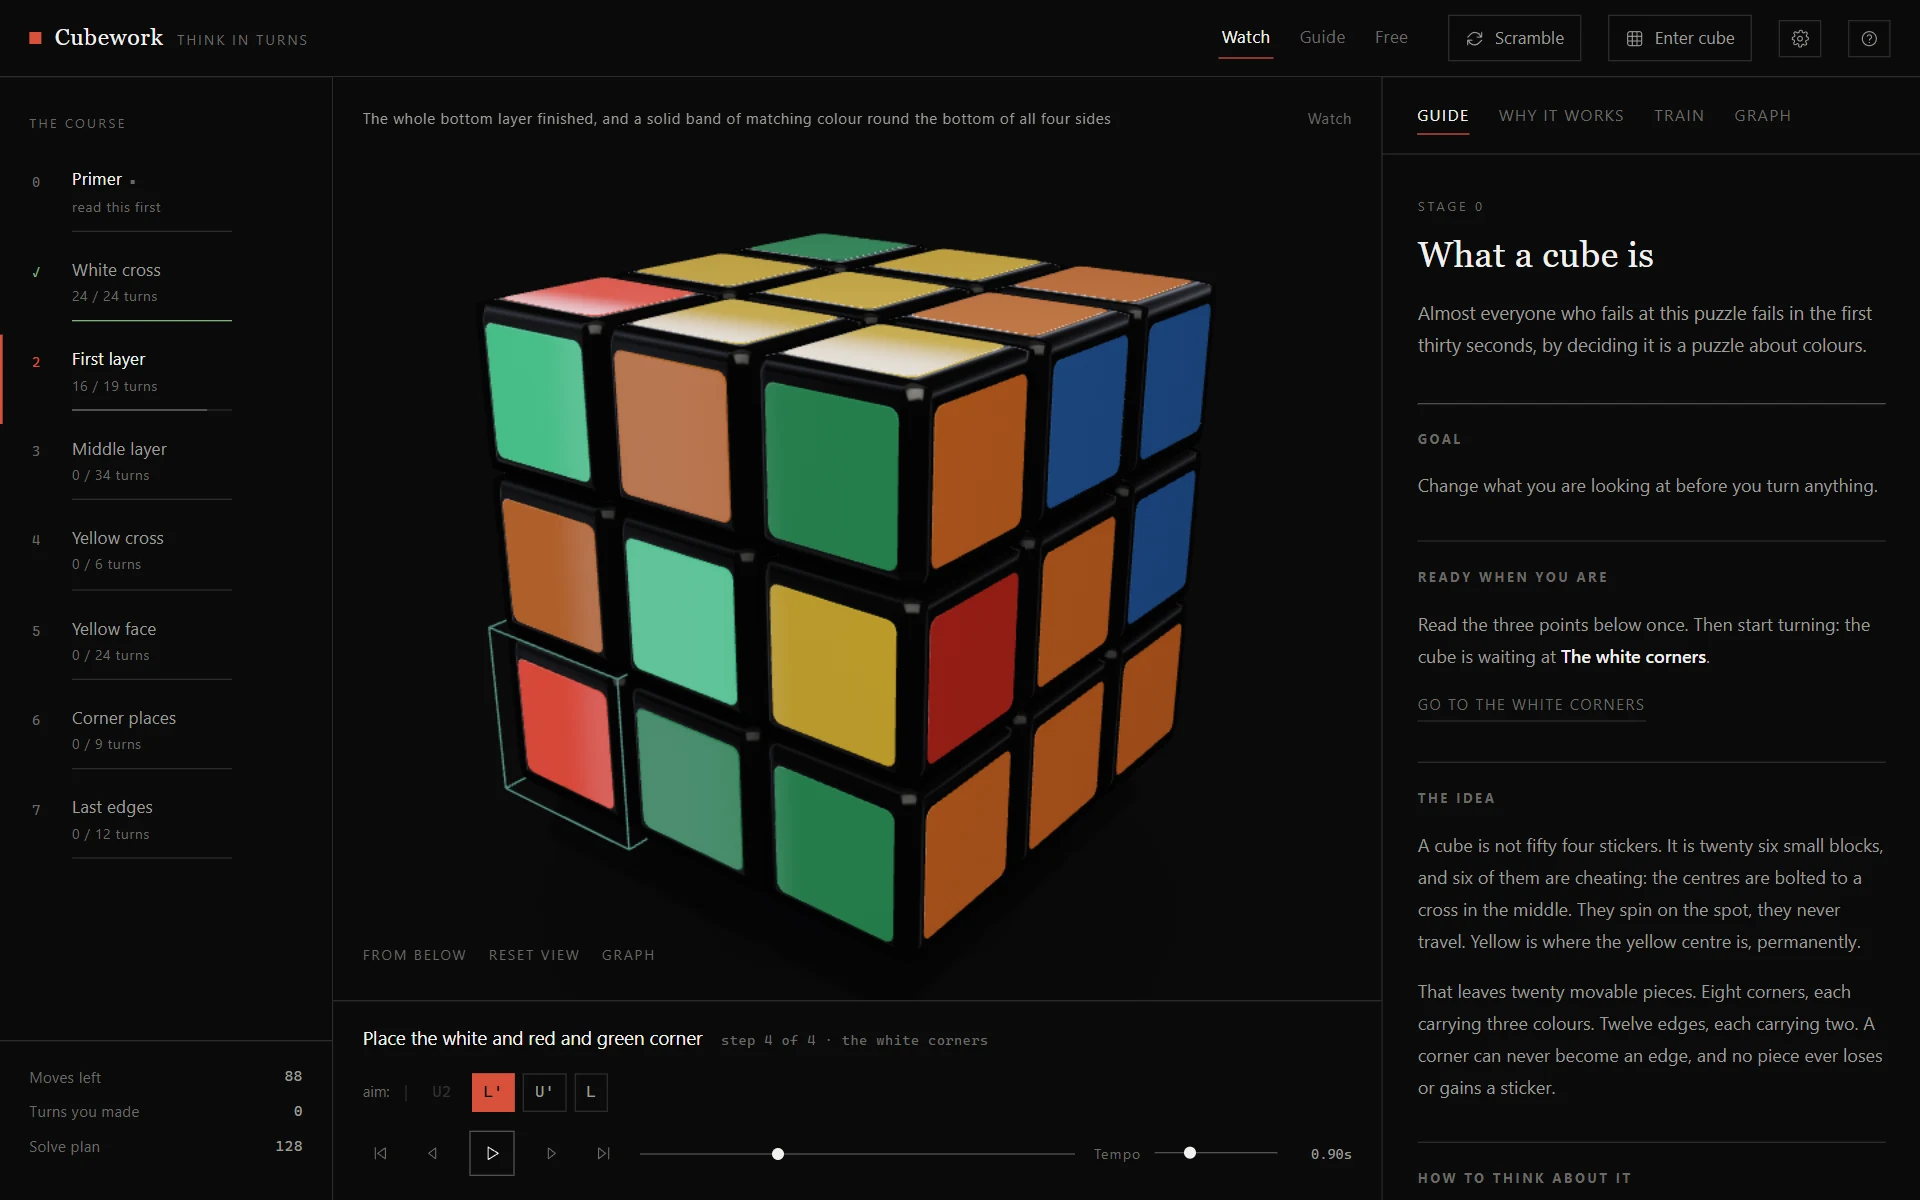
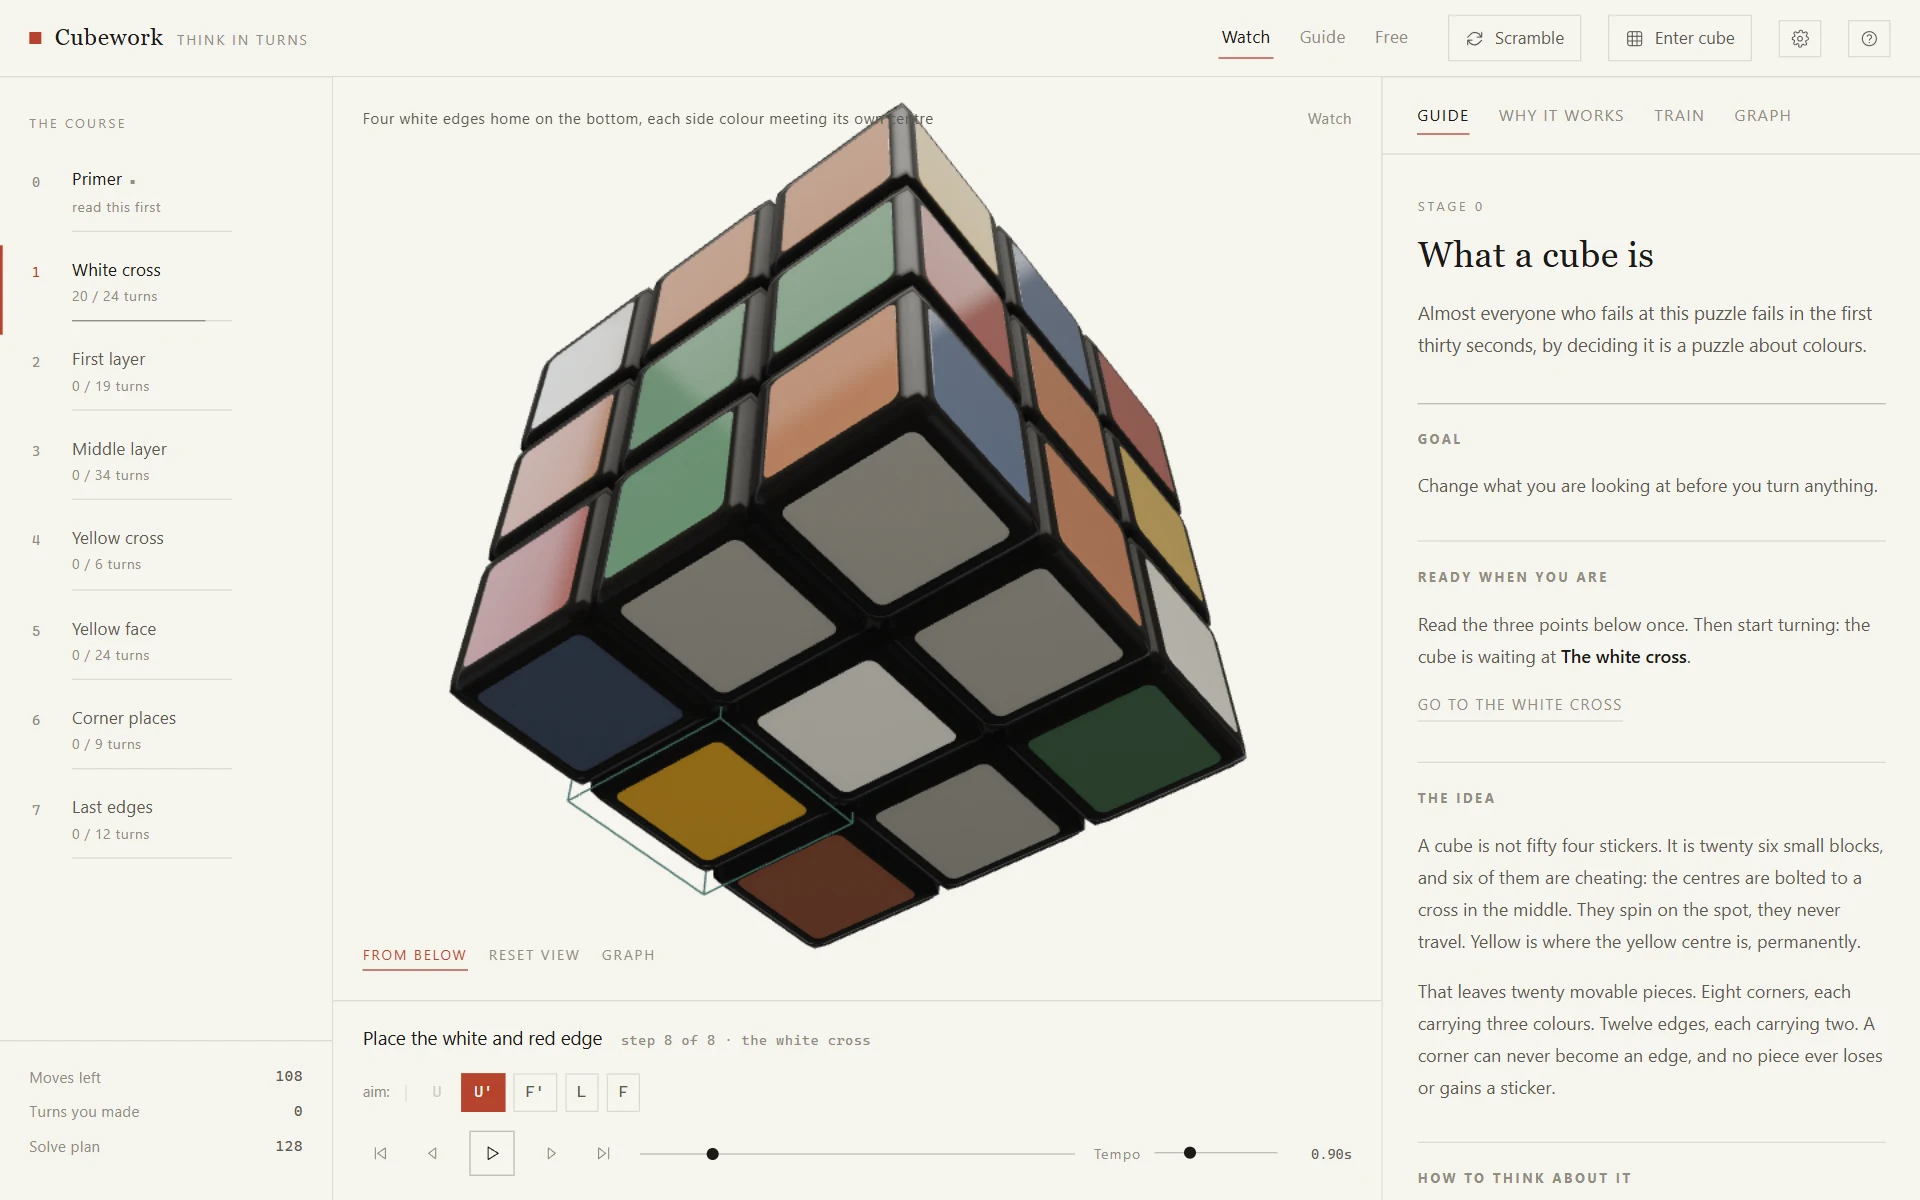
KuroBlack. Here the soft box reflections in the clear coat carry the picture.
Light and material without a single image file
Graph two
The solve as a path through the state graph
Zoom out and every position of the cube becomes a point itself, joined to every position one turn away. That is the state graph, also called the Cayley graph. It has 43,252,003,274,489,856,000 points, and since 2010 it has been proved that none of them is more than 20 turns from solved.
The layer method takes a longer path on purpose. Each stage walks into a smaller set of positions that keeps the work already done, until only the solved point is left. Every leg is short enough to find by hand.
Under the graph, Cubework draws that path as a strip: one value per state, the number of points that are home. The line climbs, but not on every turn. Inside an algorithm it falls, because the algorithm borrows finished work and hands it back at the end. Clicking the strip jumps to that state.
Allow only progress that shows on every step, and you have ruled out the deep moves.
Six lessons, each with its own animation
More views
Architecture
One cube model, four surfaces
- Scramblerandom or fixed by link
- Your own cubepainted as a net, checked against three cube laws
- Your turnson the cube, in the graph or by keyboard
- 3D cubehand written WebGL2
- Sticker graphroute, arrows, turn direction
- State pathpoints home per turn
- Teaching textstage, idea, mistake, exercise
Everything reads the same piece model: 26 parts, each with a position and an integer rotation matrix. No view keeps its own copy, so they cannot drift apart.
What sits underneath
Where the pattern carries over
- Product configurators whose rules should explain why an option is unavailable right now.
- Assembly and maintenance sequences where the order is the actual content.
- Training for processes with many states and few allowed transitions.
- Any interface that should teach the way to a result, not just show the result.
Image credits: every image and video on this page is a screen capture of our own application.
Why this is published
What this means for your project
More from the lab
 Method Event Scout A language model reads the event pages; everything else is fixed code. What remains is a short list of where a day in person is worth it.
 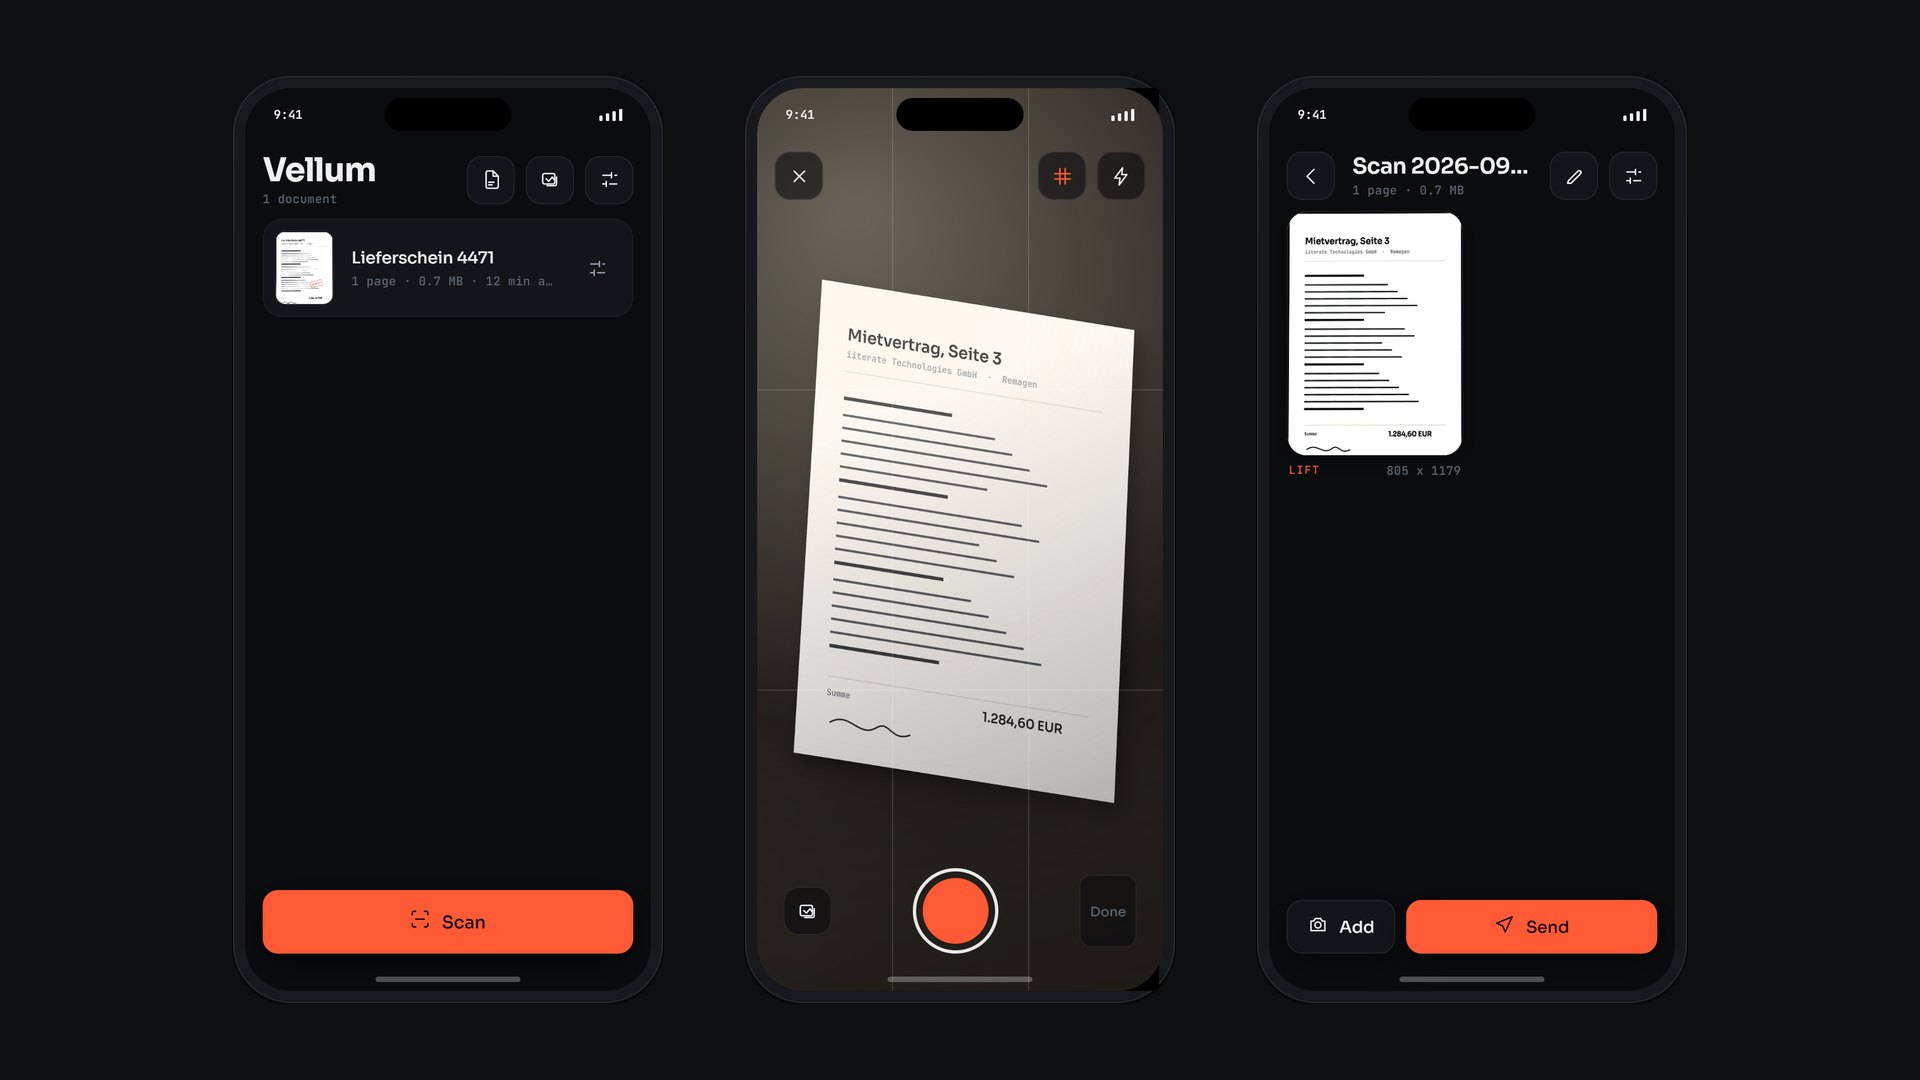 Applied Research Vellum Edges, perspective, light and text are all worked out on the phone. A document leaves the device only when someone sends it.
 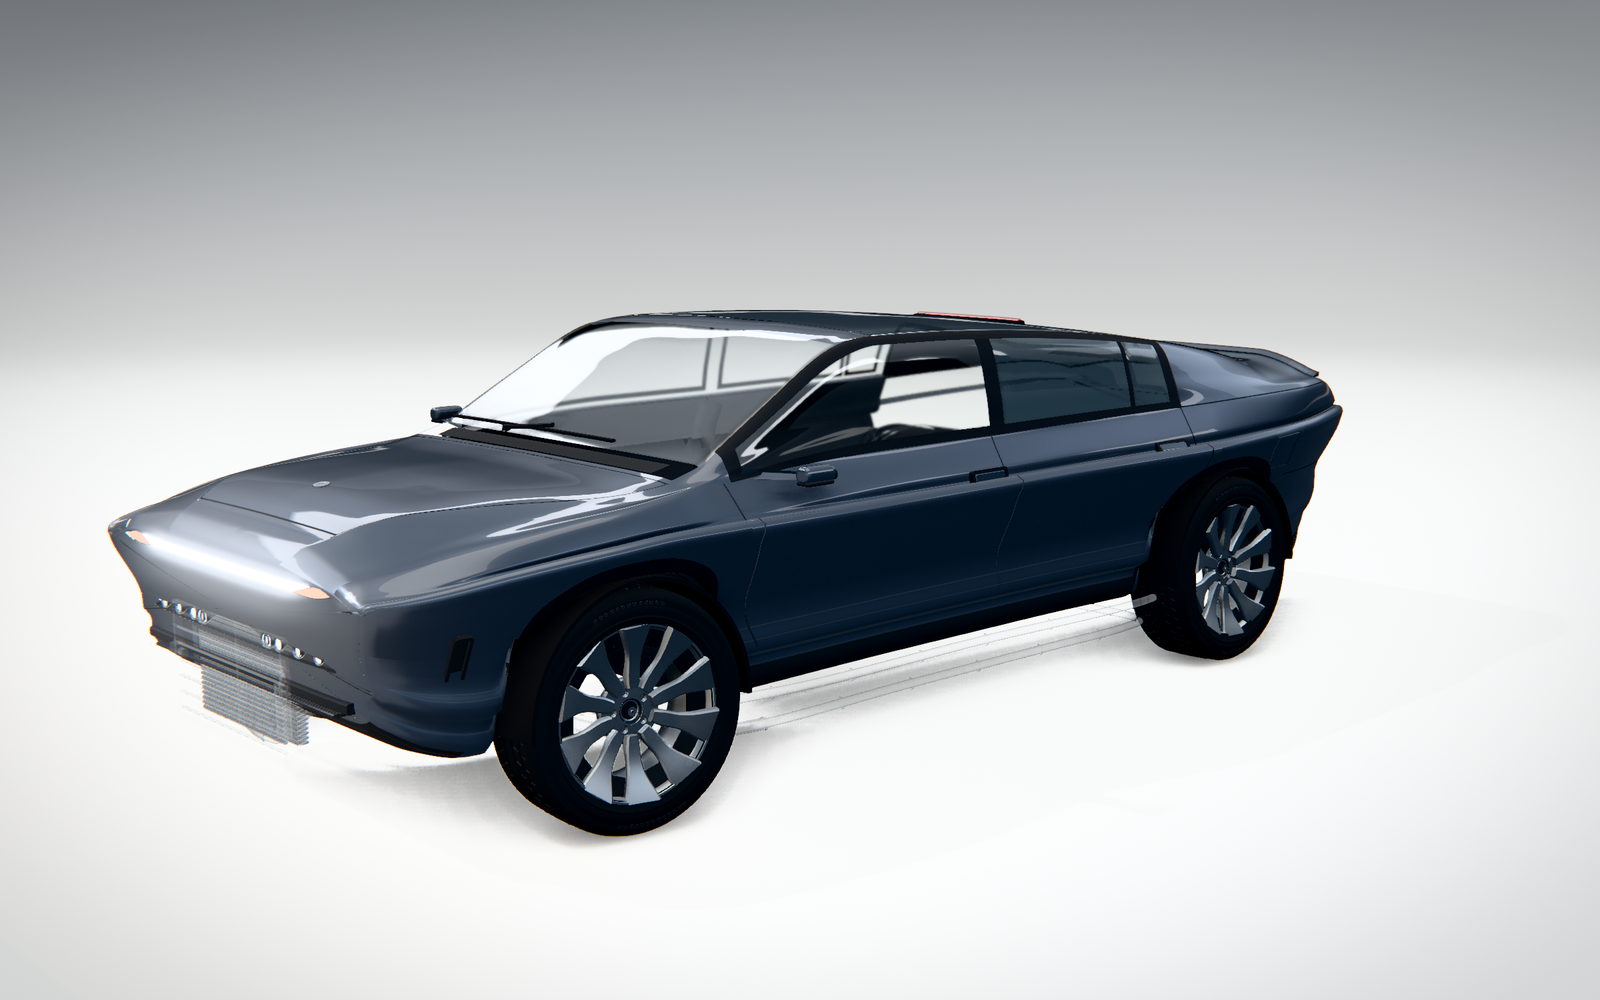 Computational Design Atlas EV1 Twelve chapters take an electric car apart, down to a single cell. No model files, no textures: 327 parts generated from one dimension table.
 Does your product have more states than a manual can show? It can become a tool that explains the next step.
Get in touch