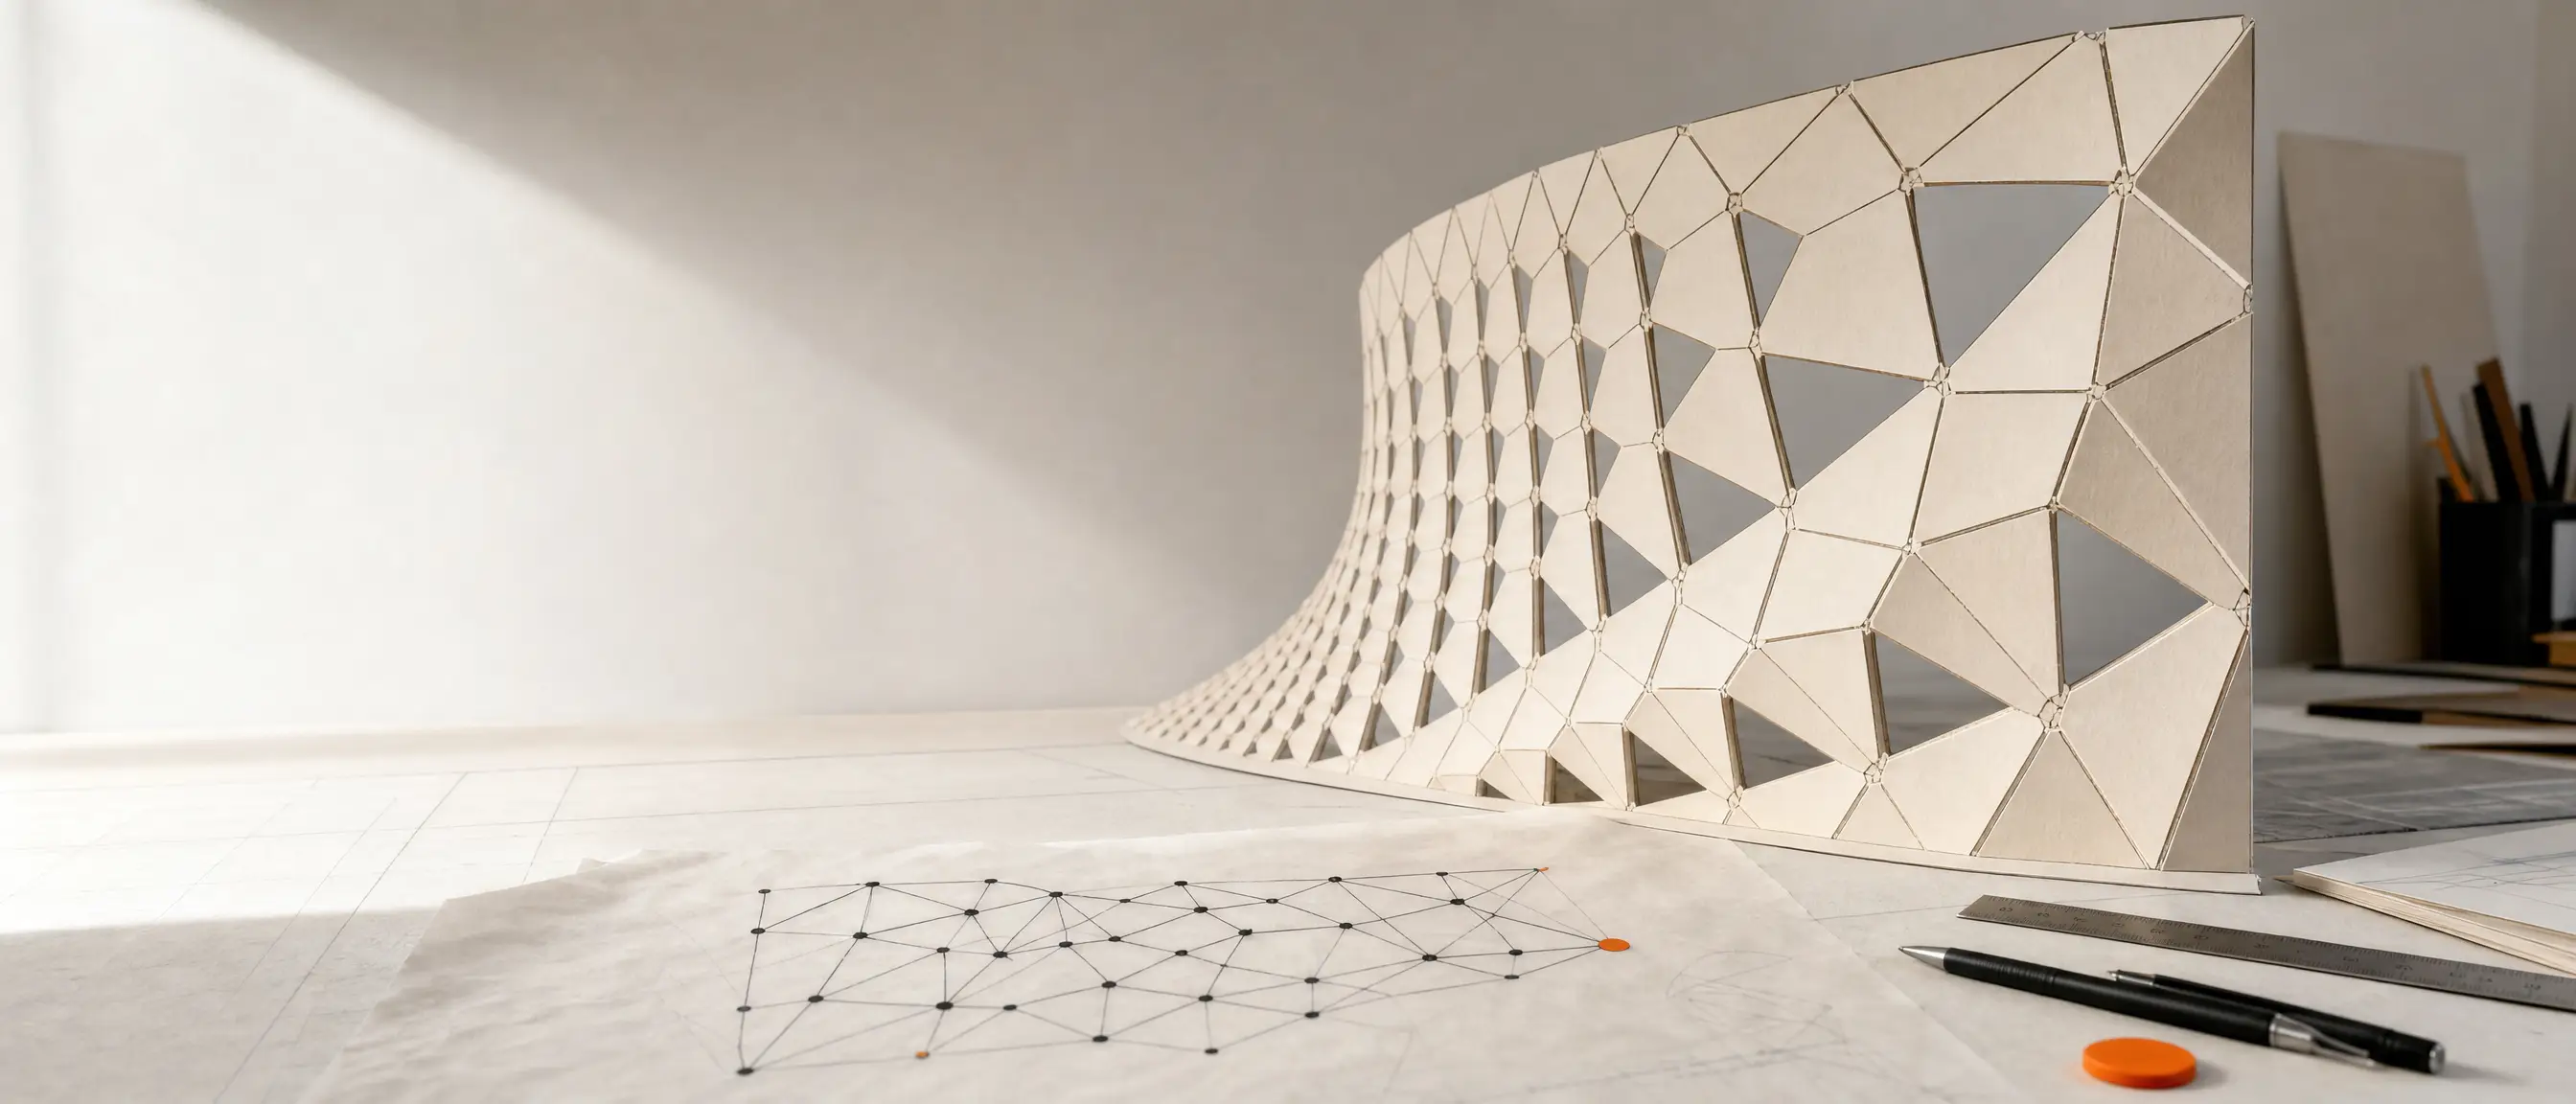
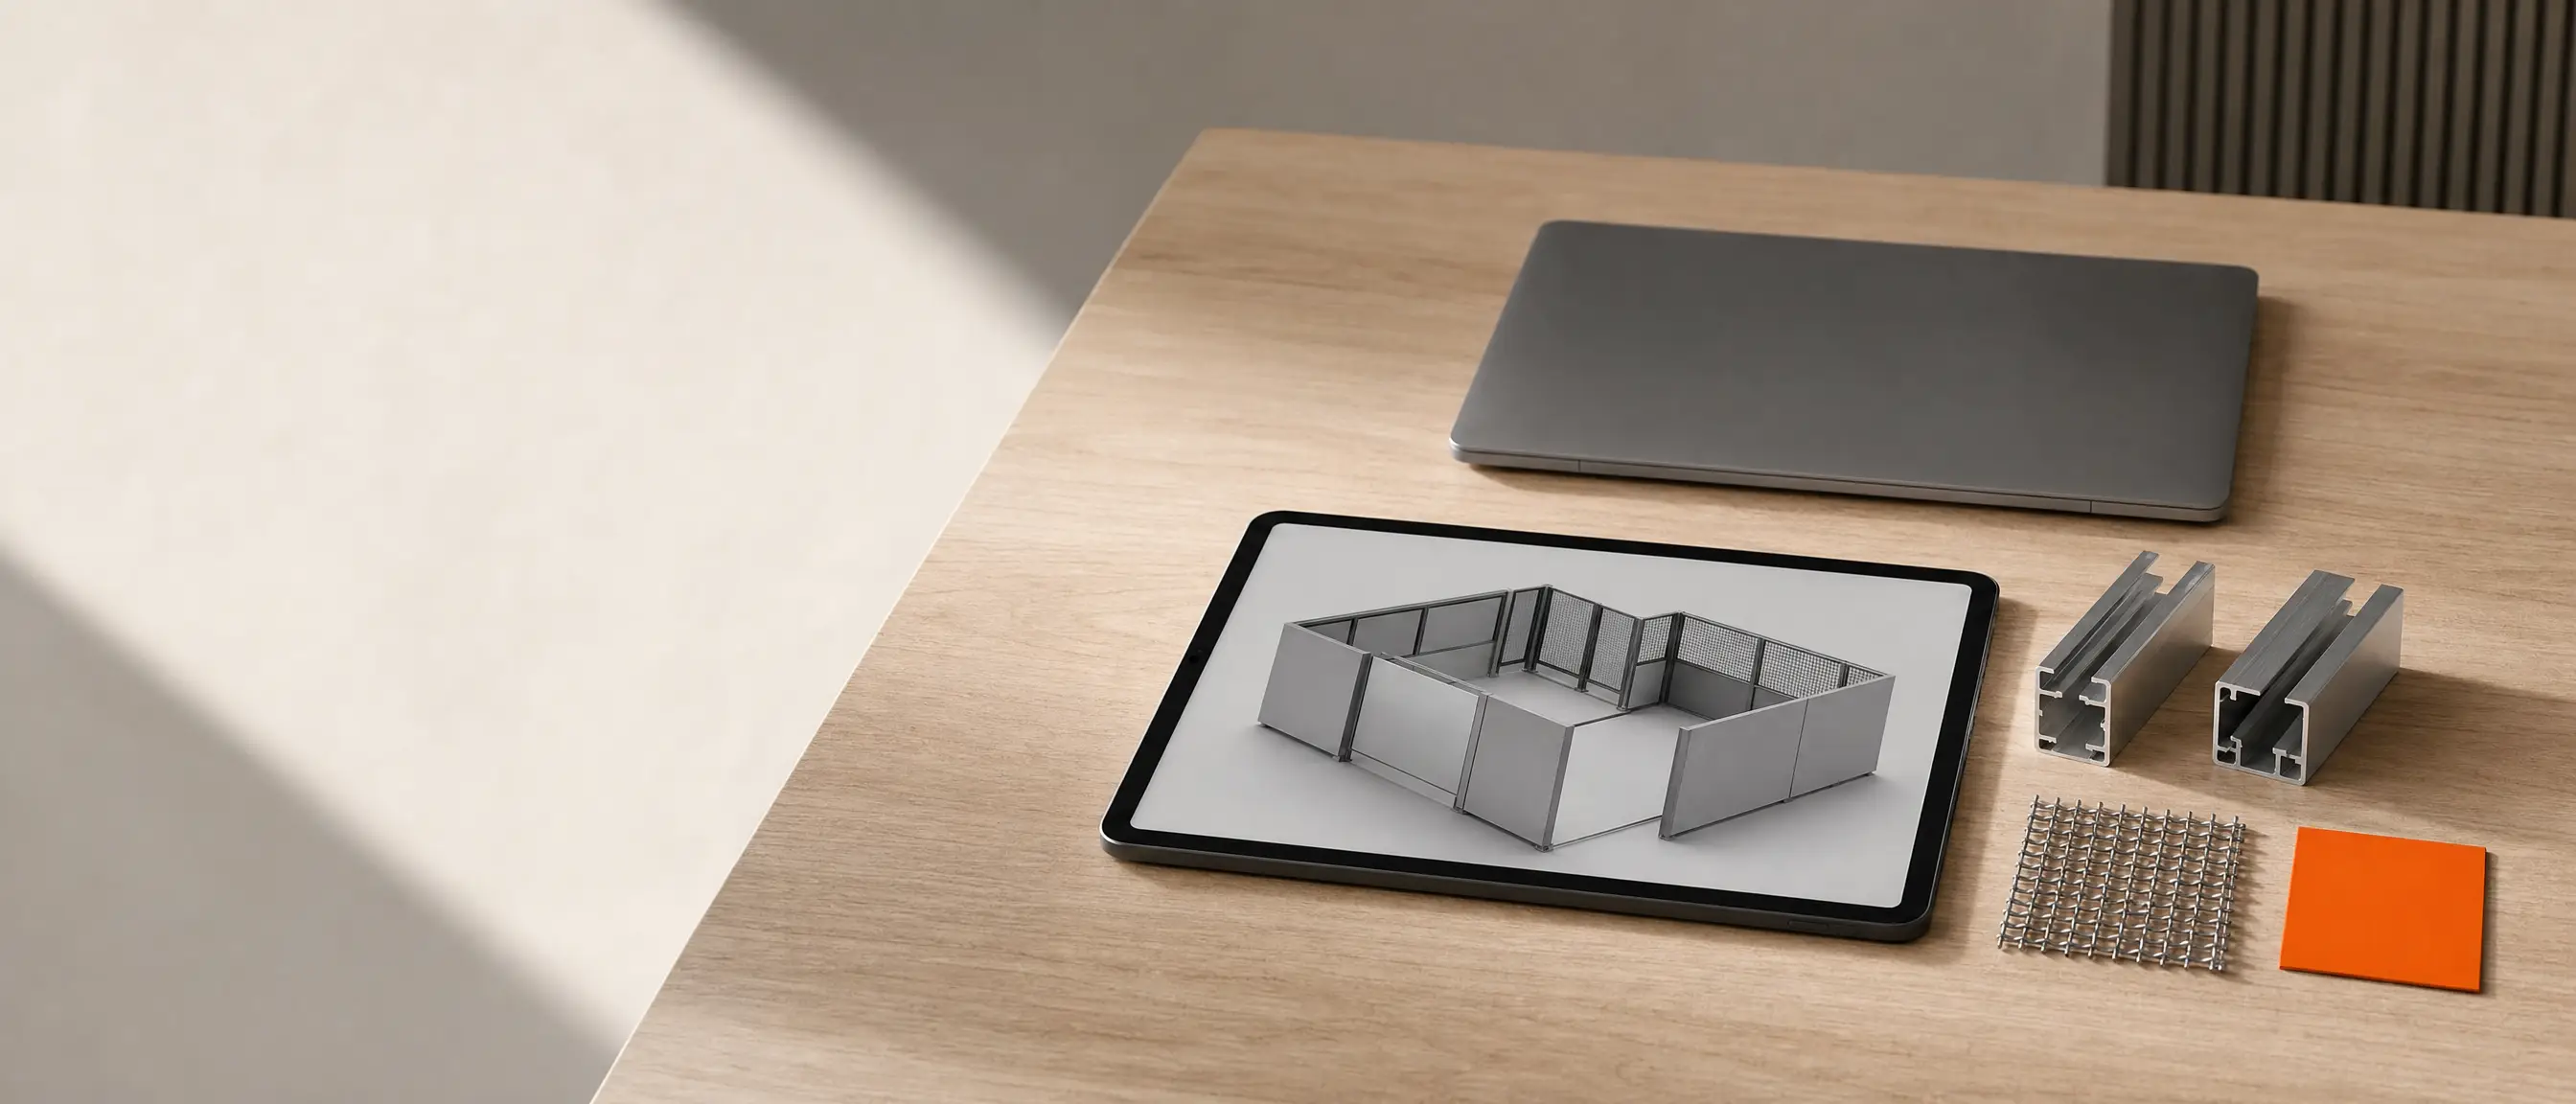
AI-GENERATEDAI-GENERATEDIllustration, AI-generated: a facade made of many slightly different panels. Not a photograph from a project.
Does this sound familiar?
One example: a design office draws the shelving wall of every new branch for a retail chain, and every branch turns out a little different. Choose the situation closest to yours, and the page adapts its route and calculation to it.
What we build for it
A parametric definition with automatic drawings and bills of materials.
A rationalisation into panel types, with nesting and DXF for manufacturing.
A variant study with every allowed combination.
Where the route starts
In the Clarify stage: there we calculate the break-even with you.
Usually straight at the prototype, because the geometry is usually already in place.
Usually straight at the prototype: that is where the variant study itself is built.
At the start stands a rule that computes geometry from parameters, that is, adjustable input values. Depending on the task, this produces variants, cutting patterns, drawings or a configurator in the browser.
In the example, every shelving wall costs the same hours to draw again; a rule costs more at first and then little per branch. Enter your own figures: where the lines cross, the rule has cost less time overall.
For series elements like the shelving wall, count the variants of a year and the hours of a typical drawing.
For facades, treat a panel type that would otherwise be drawn and unrolled individually as a variant.
For variant studies, a variant corresponds to one drawn study, and the rule mainly saves the rounds after every change.
Calculation on this page · hours and EURBreak-even after 4 variants, still within the first year
Drawn route Computed route with the rule
Break-even after
4variants
Hours with the rule in year one
41.1h
Savings in year one
59.7h
Hours per change round
0.9h instead of 6.0 h
Value of the savings in year one
3,605EUR
Payback
-no budget
The savings are roughly equivalent to 7 shelving walls that, change round included, do not get drawn again.
With a budget of 0 EUR, the amount would be offset by the hours gained after about 0.0 months.
Enter a budget of your own, and the calculation shows here after how many months the amount is offset by the hours gained.
Drawn per variant = effort × (1 + share with a change round) · Computed per variant = 0.15 × drawn · Break-even = hours to build the rule ÷ (drawn − computed), rounded up · Value = savings in year one × labour cost per hour · Months to payback = budget ÷ (variants per year × (drawn − computed) × labour cost ÷ 12)
The defaults show example figures for the design office from the example. A change round is assumed to cost as much as drawing a second time. A computed variant costs 15 percent of a drawn one, because only the values are set, the result checked and the file produced.
Payback counts the savings of a full year without the hours to build the rule, because your budget already covers that work.
Worked example with your inputs, not a forecast. For one-off designs, unclear constraints, or a design that lives from breaking the rule, even an early break-even point helps little.
Routes from A to B
From drawing to rule in four stages
This is how a project usually runs. After each stage you decide whether and how to continue, and the highlighted stage shows where most people with your starting point begin.
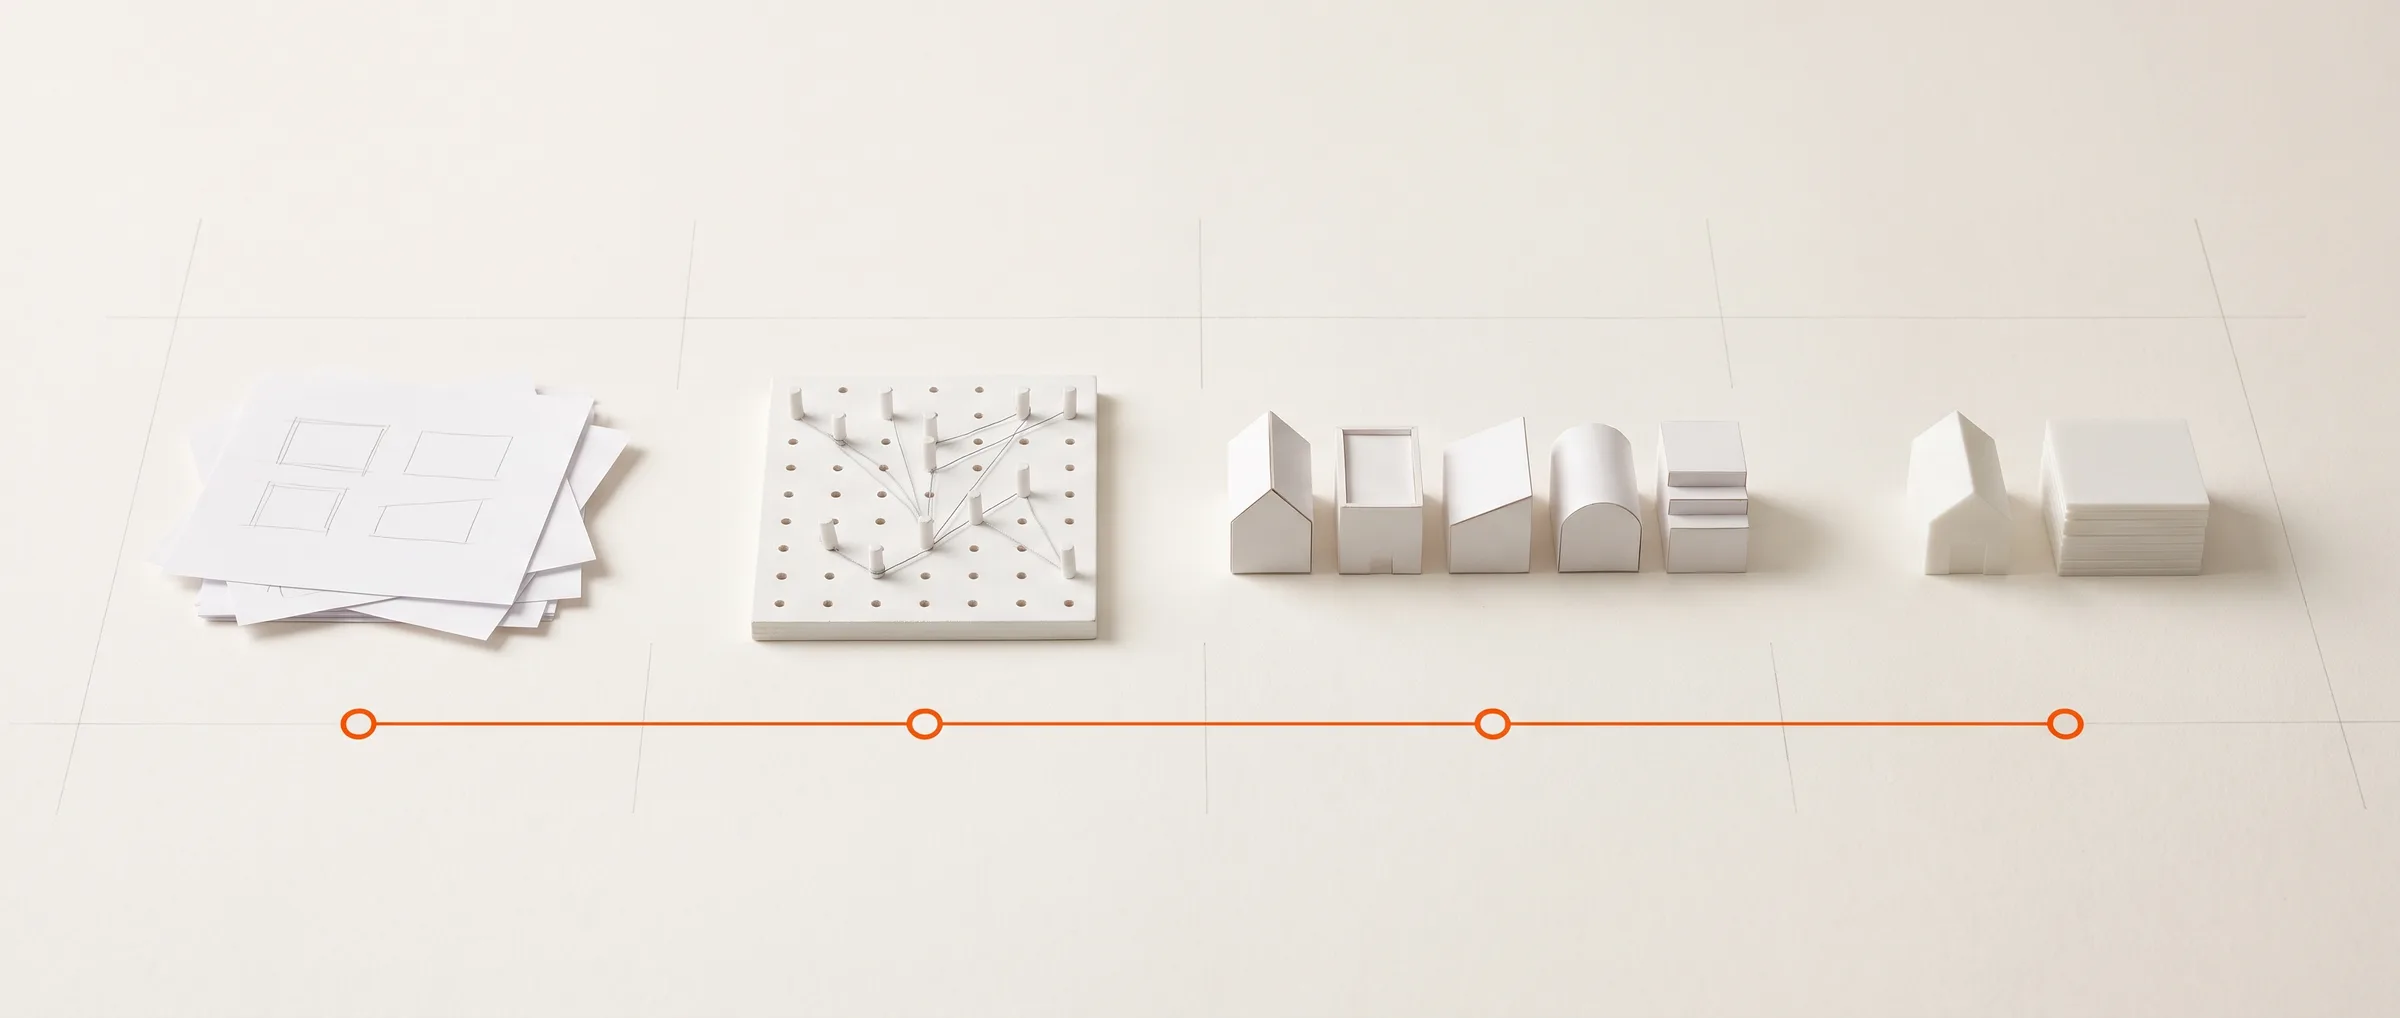
AI-GENERATEDAI-GENERATEDIllustration, AI-generated: from the sketch through the rule to computed variants and cutting.
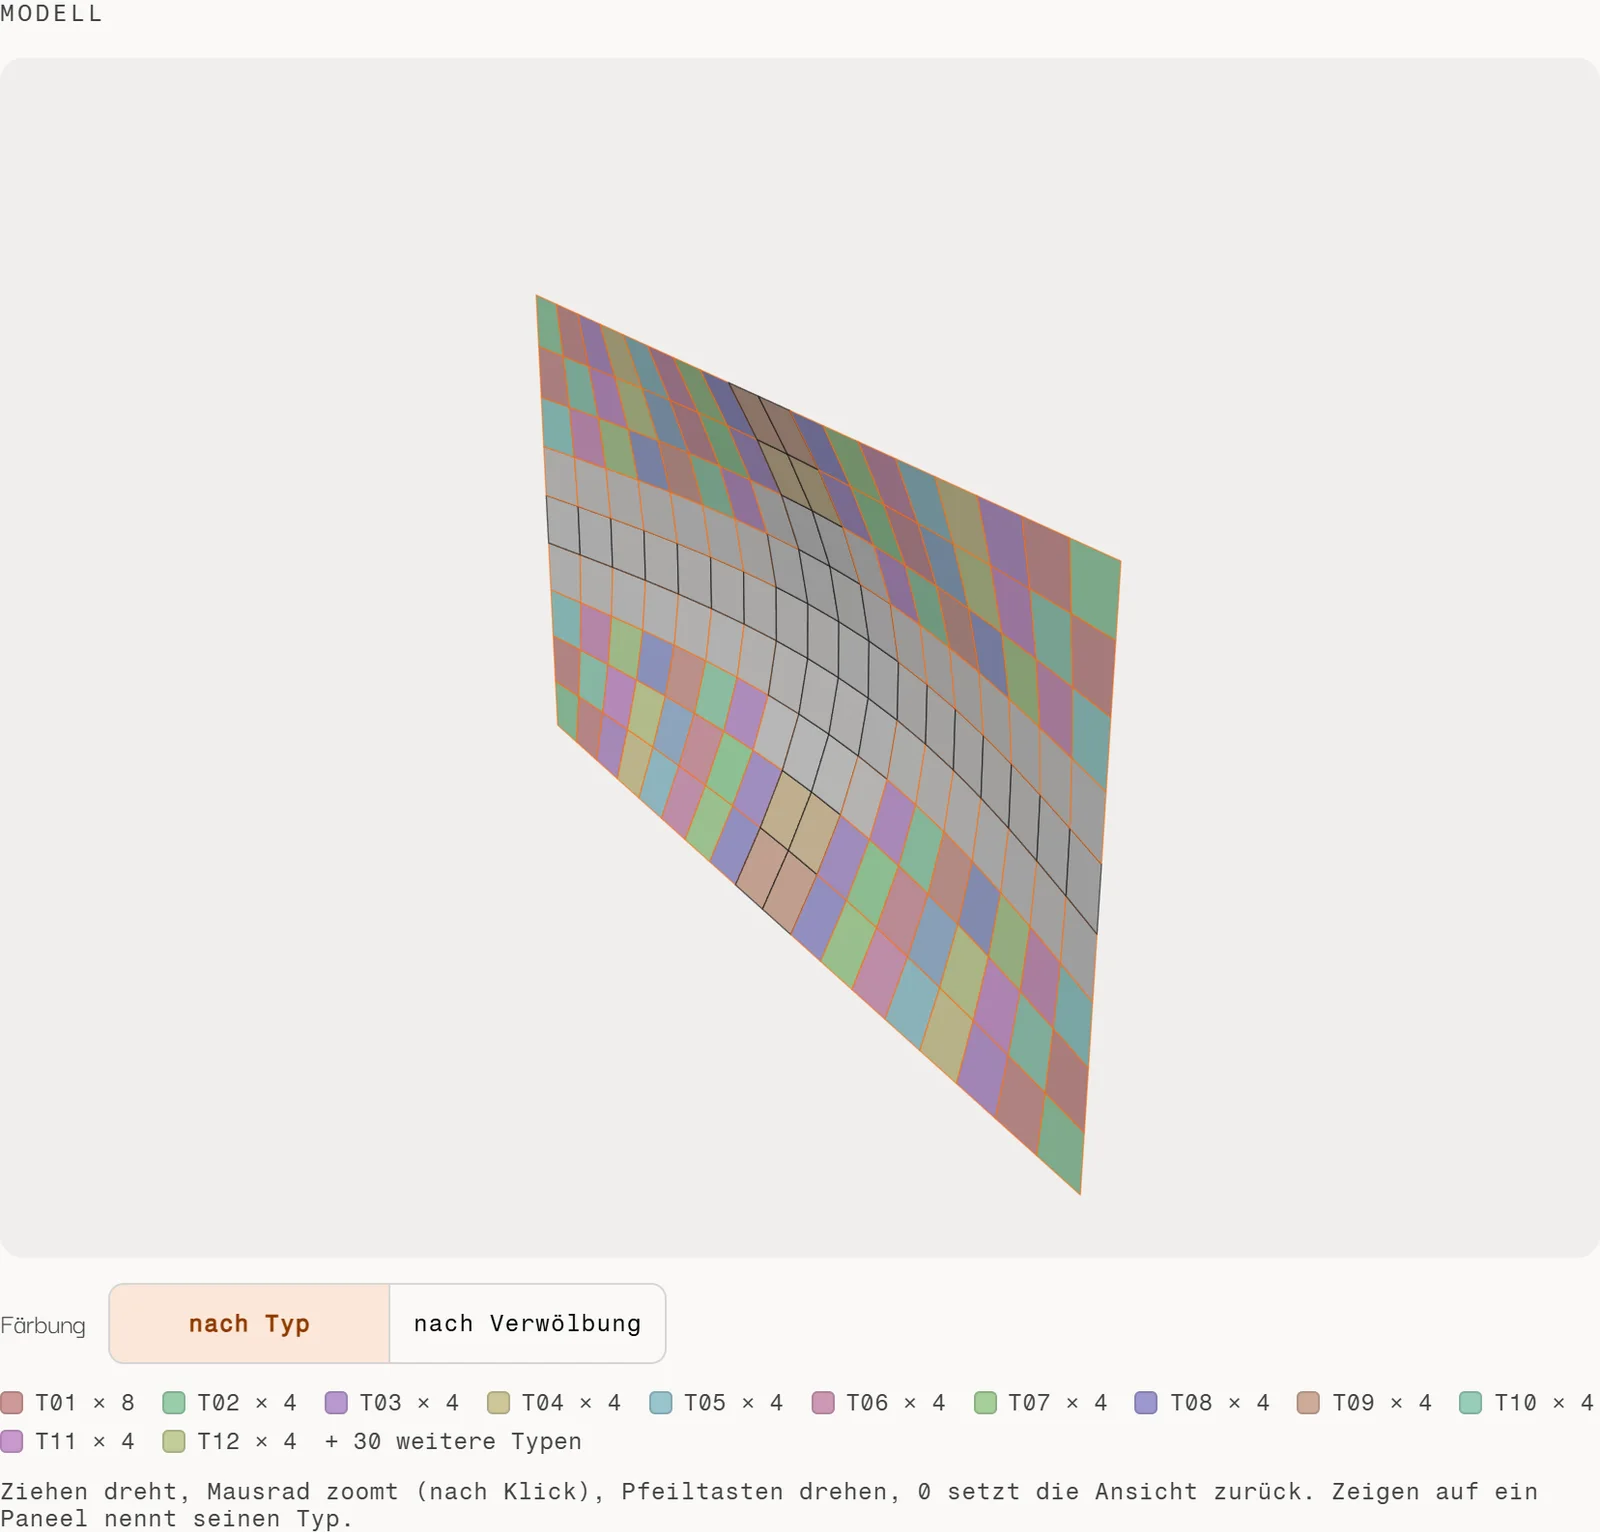
Check beforehand for yourself how many panel types a curved surface produces (tool in German): Fassaden-Rationalisierer
Clarify
Most projects with this starting point begin here
We write the rules down with you, calculate the break-even with your figures and choose a reference element.
For series elements, the break-even shows first at what quantity the rule pays for itself.
The geometry is usually already in place, and the Fassaden-Rationalisierer gives a first overview, so Clarify stays short.
This is what a project typically looks like in files and milestones. Which results apply to you, we settle together in the Clarify stage.
Clarify
The basis for deciding where to start.
Document
Recording of the rules
Records parameters, dependencies and constraints, so the rule can be checked before it is programmed.
Document
Break-even calculation with your figures
Shows at what quantity the rule costs fewer hours than drawing.
Document
Choice of a reference element
Sets the element the rule is built and measured on first.
Prototype
A measurable version built on a completed project.
Code
Parametric definition for the reference element
Computes the element from named inputs, so new dimensions produce new geometry.
Document
Comparison with the drawn version
Shows, on a completed project, where the rule and the drawing agree and where they differ.
File
Export sample
Checks with DXF, CSV or IFC whether detailed planning and manufacturing can work with the files.
Rollout
The rule in the daily work of detailed planning and manufacturing.
File
Outputs for detailed planning and manufacturing
Supply drawings, bills of materials and cutting patterns from the same calculation.
Code
Integration into Rhino and Grasshopper or a web interface
Puts the rule where your team or your customers work with it.
Training
Training for the responsible person
Shows the person who is responsible for the model how to change inputs and limits themselves.
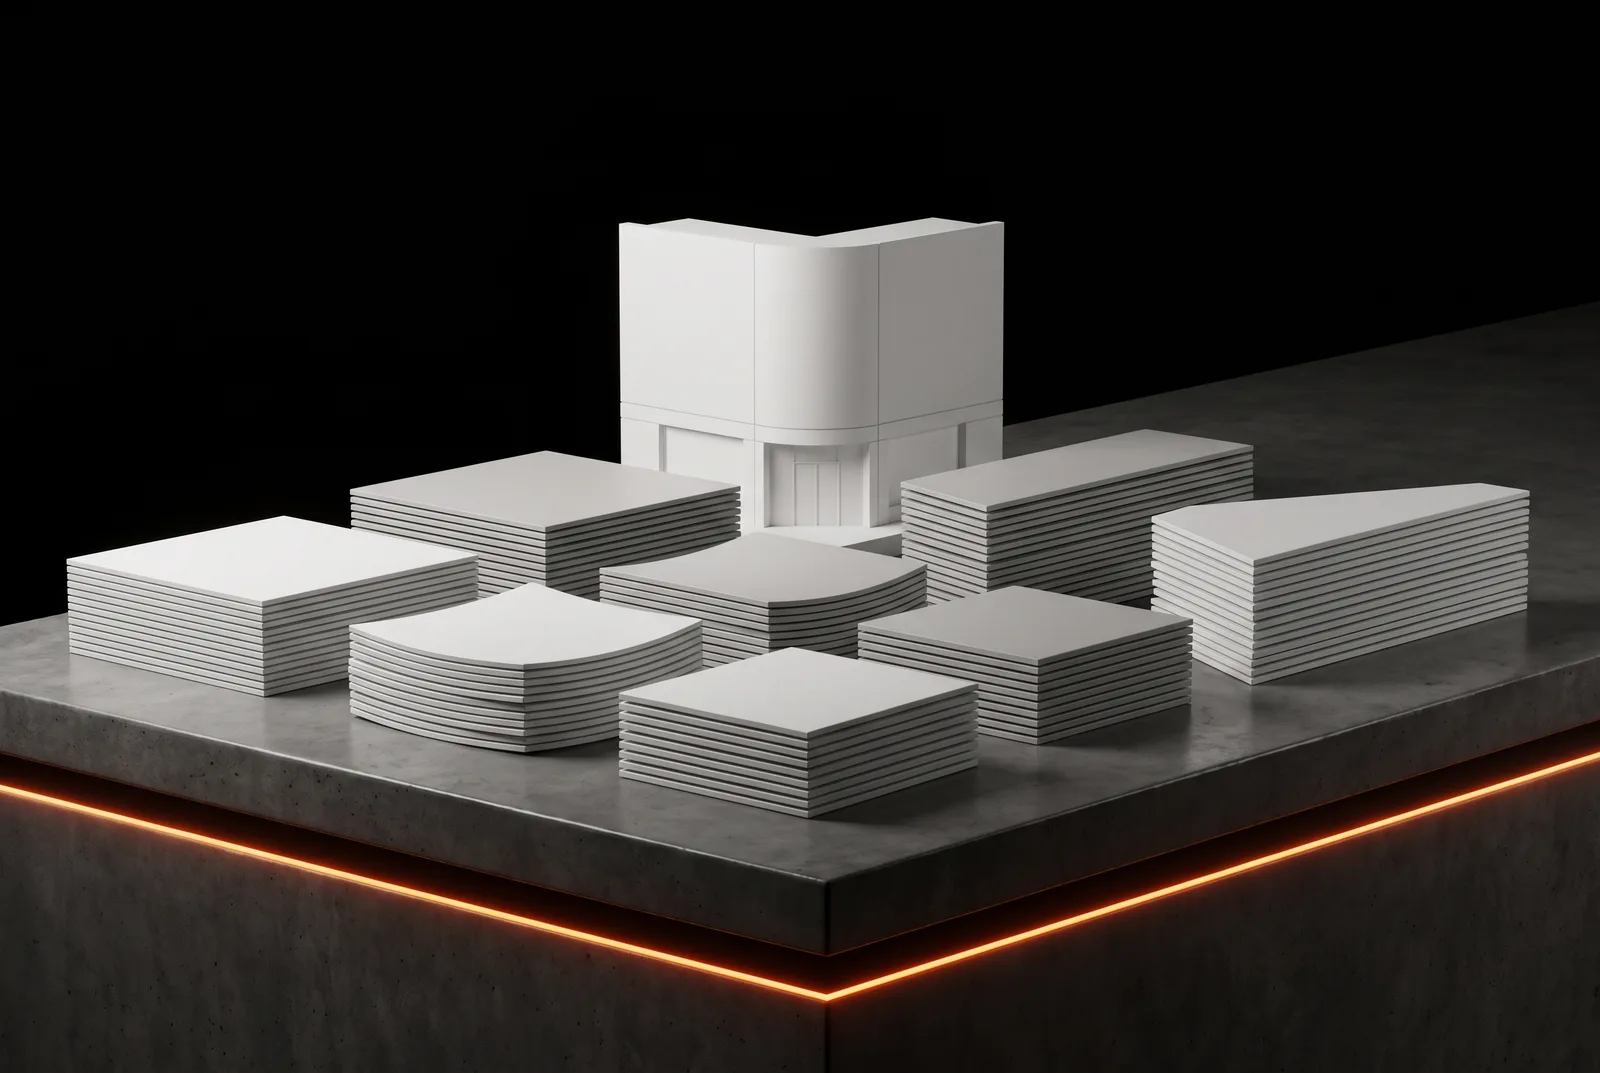
AI-GENERATEDAI-GENERATEDIllustration, AI-generated: cut panels, sorted by type, and the model beside them.
Operation and expansion
The basis for taking the rule further.
Document
Documented definition
Names inputs, outputs and conditions, so people other than the author can take the calculation further.
File
Sample files and export profiles
Contain runs with a known result, against which later changes can be checked.
Code
Further elements on request
Carry the same approach over to the next recurring component.
What a variant space looks like
The demonstration computes a simple office building from four limits: building length, building depth, storey height and allowed grid modules. Every combination is plotted by usable area against envelope area, and clicking an orange point shows its floor plan.
Demonstration · every combination computed4,011 combinations computed
36.00 m long · 16.00 m deep · 60 modules of 600 mm
Grid module / modules
600mm / 60
Building depth
16.0m
Usable area
511m²
Usable area per m² of envelope
1.23m²
On the orange line lie the variants for which no other combination has both more usable area and less envelope, and that is where the discussion starts.
The figures are calculated on this page and are not project figures.
Projects
Projects, tools and studies
The shelving wall is a made-up example. The following work really exists: two client projects, two public tools and one of our own studies from the R&D Lab.
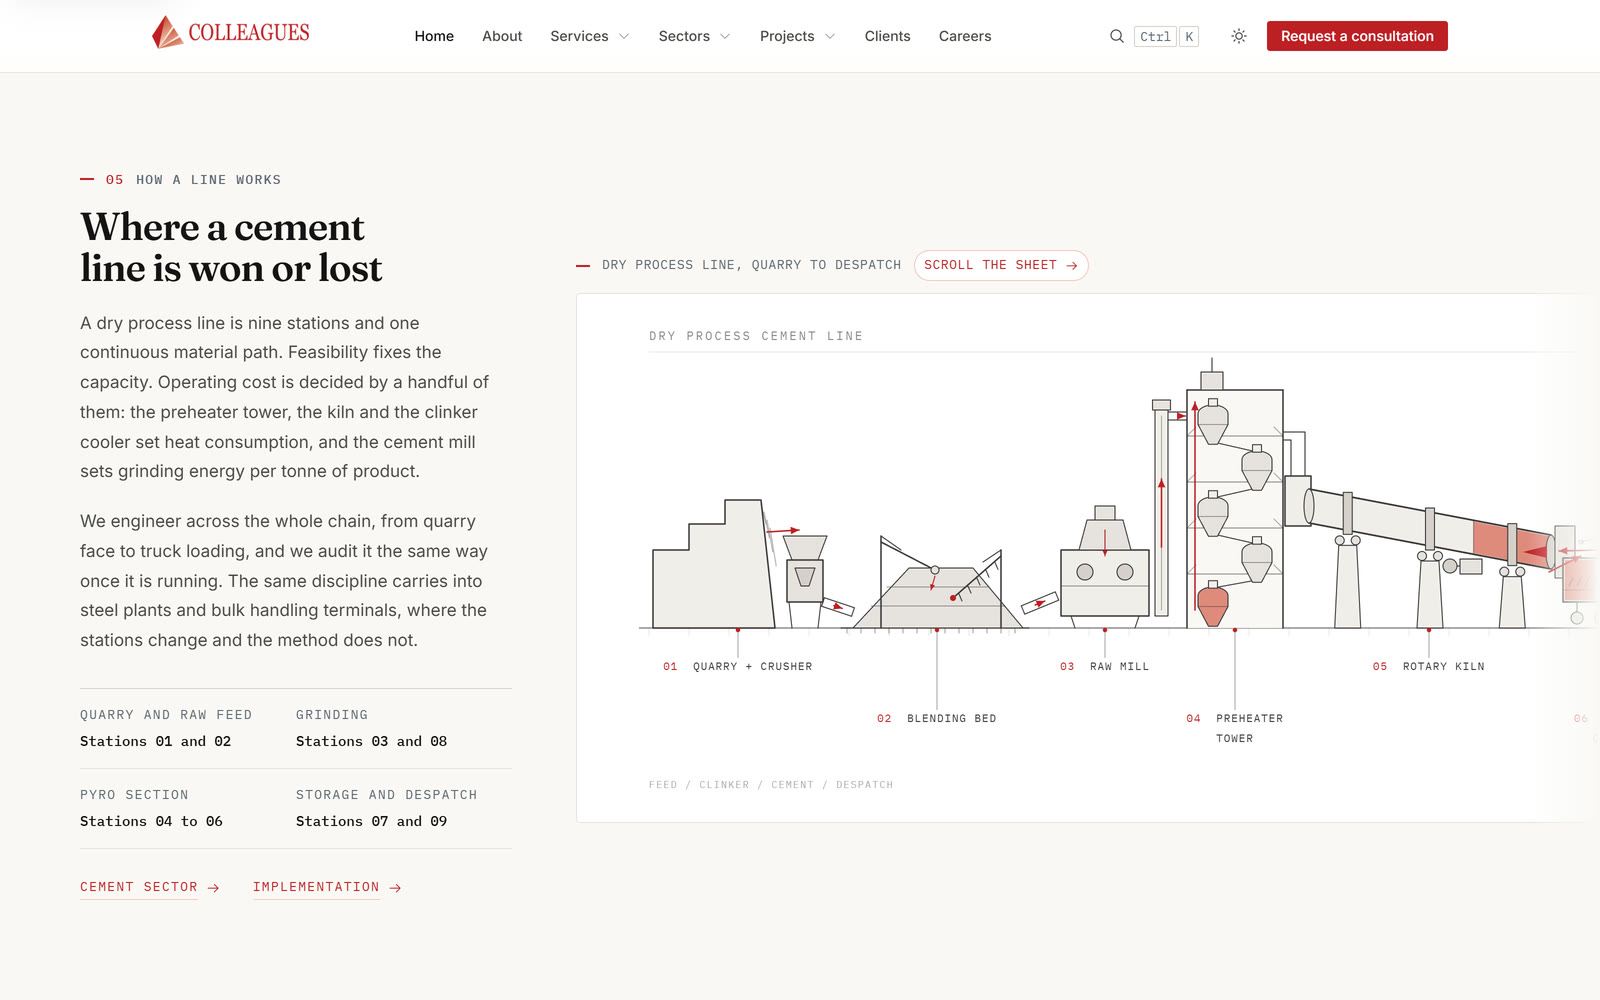
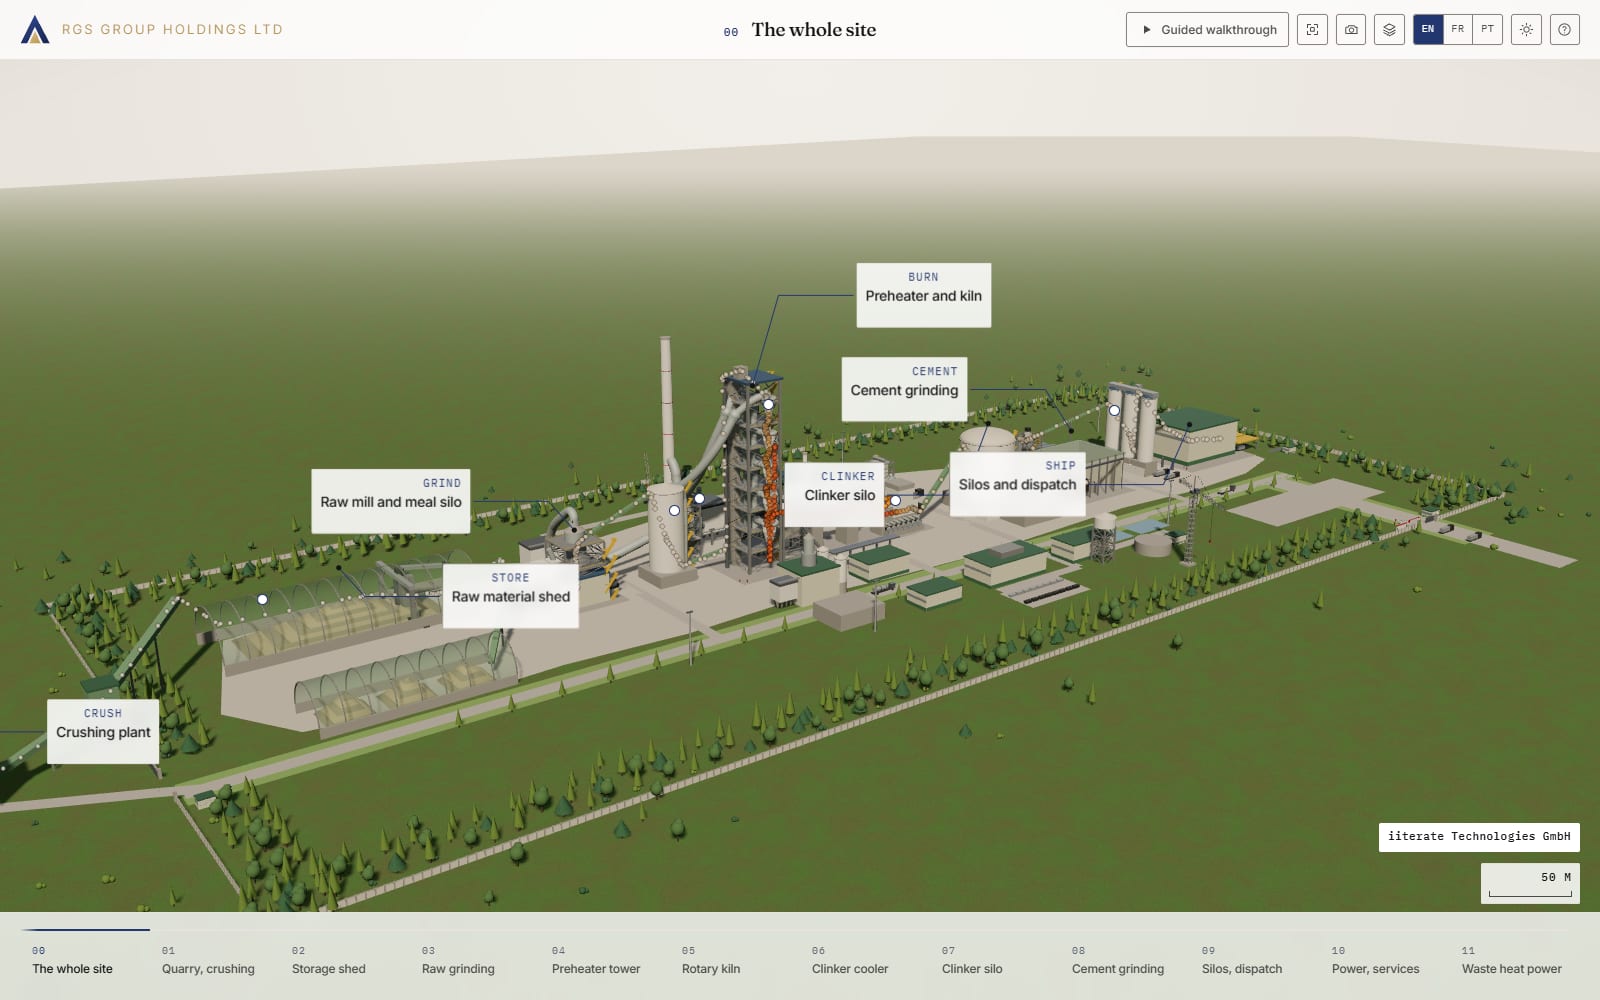
Screenshot, built for RGS Group Holdings.
Project, built for RGS Group Holdings
Inside the Line
Starting point
A cement plant was to become walkable in twelve stations, with labels, sections and figures that match the geometry.
Implementation
The site is computed: kiln length, tower height, silo diameter and belt routes are stored once, in metres, in one file, and geometry, cameras, labels and section planes read from it.
What it shows
A validation run recomputes every printed figure from the geometry and stops if the text and the model disagree.
We write the rule; the knowledge about your task lives in your company. These are the points where the two come together.
How a project runs, with the contributions of both sides
Step
What happens
Your contribution
First conversation
We talk about the task that keeps recurring, and about the quantities of a year.
Two to three completed example projects with drawings and bills of materials.
Clarify
We write down parameters, dependencies and constraints, and calculate the break-even.
The rules and standards that apply to the element, even if so far they only exist as experience.
Prototype
We build the definition for the reference element and compare it with the drawn version.
Feedback on the interim versions from planning or manufacturing.
Rollout
We set up the outputs for detailed planning and manufacturing and train your team.
One person who will later be responsible for the model and takes part in the training.
Does a rule fit your task?
Not every recurring task needs a rule. The two lists help with a first assessment.
A good fit if
The task recurs again and again with changing figures.
The rules can be formulated, even if nobody has written them down before.
The result gets built or manufactured, and someone keeps working with the files.
Less of a fit if
It is a one-off piece, built exactly once.
The constraints keep changing fundamentally, so any rule would be outdated quickly.
Nobody in your company is meant to take the model further after rollout.
Frequently asked questions about Computational Design
From how many variants does a rule pay off?+
That depends mainly on repetition and change rounds. As a rough guide from delivered projects: about five runs if nothing changes any more, and two to three once a real change round is expected. The calculator above turns this into hours and euros with your figures.
What do we need to deliver before the work can start?+
At the start are two to three completed example projects and the rules that apply to them. From these we set which quantities are inputs, within what limits, with which unit and tolerance, and which formats the next station needs. If drawings only exist as scans, structuring them is a step of its own.
Do we need Rhino in-house?+
Only if your team is meant to develop the definition further itself. If the result is a browser configurator or a data export for manufacturing, nobody on your side needs Rhino.
Which files does a parametric model deliver?+
That depends on who works with it next: IFC for planning, DXF and STEP for manufacturing, CSV or XLSX for quantities and costing, glTF for viewing in the browser. The two calculators under Tools output DXF and CSV, the nesting calculator also SVG.
We have a Grasshopper model nobody understands any more. Can we still work with it?+
Usually yes. A stocktake first shows which inputs actually exist, which branches are dead, and where fixed numbers stand that should be parameters. After that comes the choice between tidying it up and starting over.
What is the difference between parametric and generative design?+
In parametric design, you set the values and the model computes one solution. In generative design, you set conditions and goals, and the calculation searches the space of allowed values, as in the variant space above. Generative design therefore assumes a parametric rule.
Where does AI help, and where not?+
AI helps with reading requirements, pre-sorting many variants, and answering questions against standards and internal rule books, with a source. It helps little with the geometry itself, because behind a surface a language model invented there is no checkable condition. Geometry therefore comes from the rule that keeps the conditions.
Sources
Statistisches Bundesamt (Destatis, the Federal Statistical Office of Germany), press release no. 148 of 29 April 2026, “Eine Arbeitsstunde kostete im Jahr 2025 durchschnittlich 45,00 Euro” (an hour of work cost EUR 45.00 on average in 2025) (table: professional, scientific and technical services, EUR 60.40). https://www.destatis.de/DE/Presse/Pressemitteilungen/2026/04/PD26_148_624.html
The guide figures in the figure tile and in the first question come from our own article, “Wann sich ein Modell rechnet” (in German, When a model pays off), and are linked there as our own figure, not as an external source.
Which element do you keep redrawing?
How many different panels does your facade have?
Which variants do you want to compare early?
Bring two completed examples, and we calculate the break-even in conversation, as for the shelving wall in the example.
Try your surface in the Fassaden-Rationalisierer and then talk to us about tolerances, types and cutting.
Describe the site or component and the limits that apply, and we clarify in conversation whether a variant study pays off or a drawn study is faster.
We would use Google Analytics to understand which pages get read. It sets cookies and sends data to Google. It is not necessary: the site works fully without it.