

R&D LAB Data Visualisation Study Craft study, no business claim
Cosmos-Scale
Sixty-two orders of magnitude in one continuous zoom, from the Planck length to the diameter of the observable universe.
- 62orders of magnitude
- 138objects with dossiers
- 18 471galaxies plotted
- 12bands, one axis
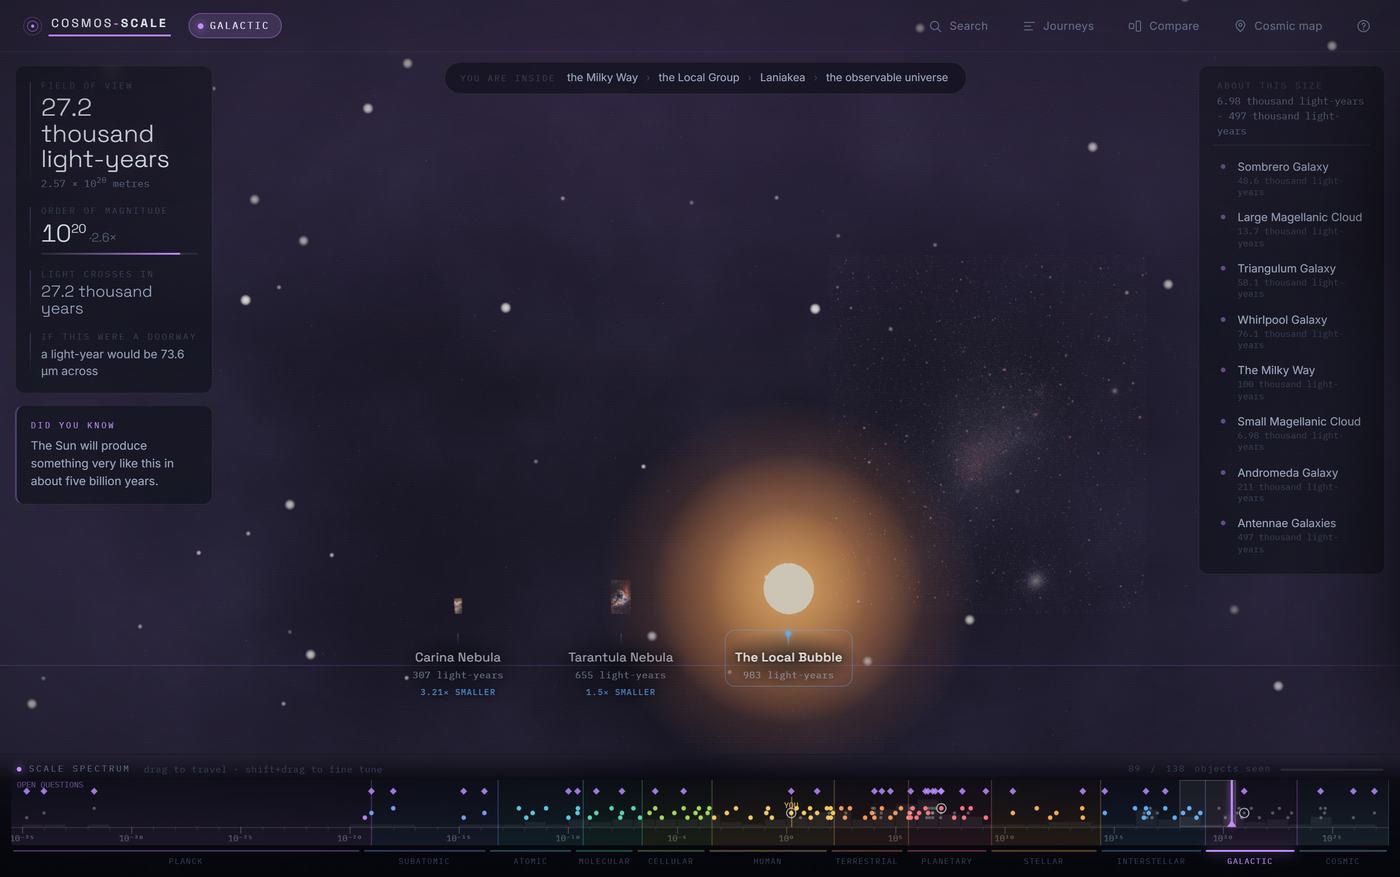
Field of view 27.2 thousand light-years, inside the Milky Way. The strip along the bottom is the application’s entire range and doubles as the control.
Why this is published
Published as a craft study and labelled as one. It carries no business claim. What it does show is that we can hold a dataset spanning sixty-two orders of magnitude in one continuous, navigable view without it degenerating into a slideshow. That is where the work in a scientific or industrial visualisation actually sits: not in the single picture, but in the route between two pictures.
A list of very big and very small things is not interesting. The ladder between them is. A human being sits almost exactly halfway between the smallest length physics allows and the largest thing light has had time to show us, and almost everything in between is stranger than it looks from either end.
Five things, one baseline
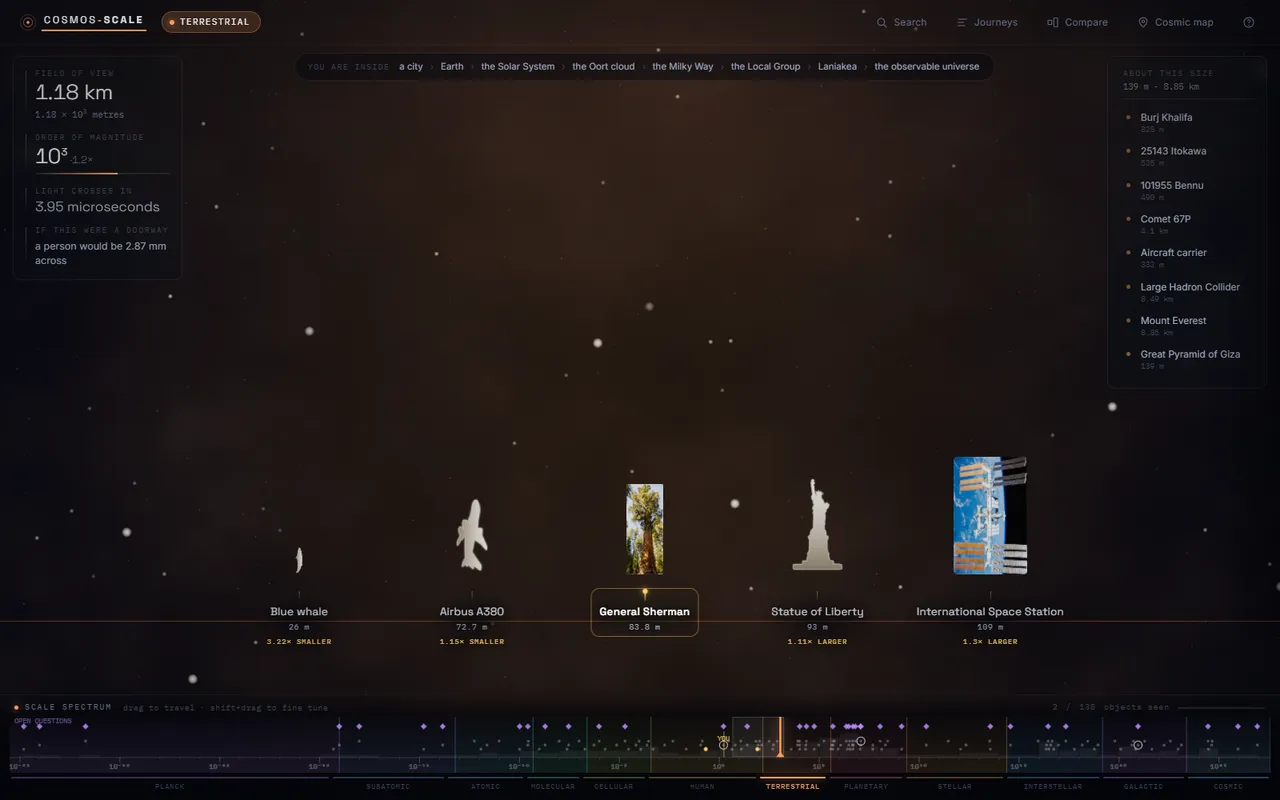
This is the whole idea in one frame. Five objects stand on the same line and their drawn height is the number underneath: Hubble telescope 13.2 metres, blue whale 26 metres, Airbus A380 72.7 metres, General Sherman 83.8 metres, Statue of Liberty 93 metres.
Under each name is not a data sheet but a ratio to whichever object is currently selected: 5.51 times smaller, 2.8 times smaller, 1.15 times larger, 1.28 times larger. That line is computed from the two sizes, not written.
The A380 stands on its tail and the whale on its fluke. That is not an oversight, it is the rule: the quoted number is always the drawn height, so where the number is a length the object is stood upright. It looks unusual, and in exchange every height stays comparable at a glance.
The problem
Why a list is not a ladder
The numbers are well known. A proton is 1.68 femtometres across, a red blood cell 7.5 micrometres, the Sun 1,392,700 kilometres. Set side by side they say nothing, because ten or twenty zeroes sit between them and nobody feels ten zeroes.
What is missing is the route between them. So everything here lives on a single logarithmic ladder and movement along it is continuous: no cut, no second slide, no new view. The strip along the bottom shows the entire range at once and doubles as the control. The line above it names, at every moment, what you are currently inside, from “a proton” through “a cell” and “a city” to “the observable universe”.
Three readouts keep the journey honest. The field of view, in metres and as a power of ten. The time light needs to cross it, from 7.58 times ten to the minus twenty-fifth of a second to 407 million years. And one sentence computed from the live field of view: on the human rung it reads “if this were a doorway, a red blood cell would be 5.86 mm across”, and in the terrestrial band the same sentence becomes “a person would be 3.99 mm across”.
The ladder has empty stretches, and they stay empty. In the subatomic band at 227 attometres only 5 of the 138 objects are anywhere near, and the stage is almost bare. That is not a loading state, it is a statement: between the smallest distance ever probed and the radius of a proton there is nothing anyone could honestly draw.
An empty decade on this ladder is a true statement about physics. Filling it would be a lie.
Climb it
Five rungs, forty-three orders of magnitude apart
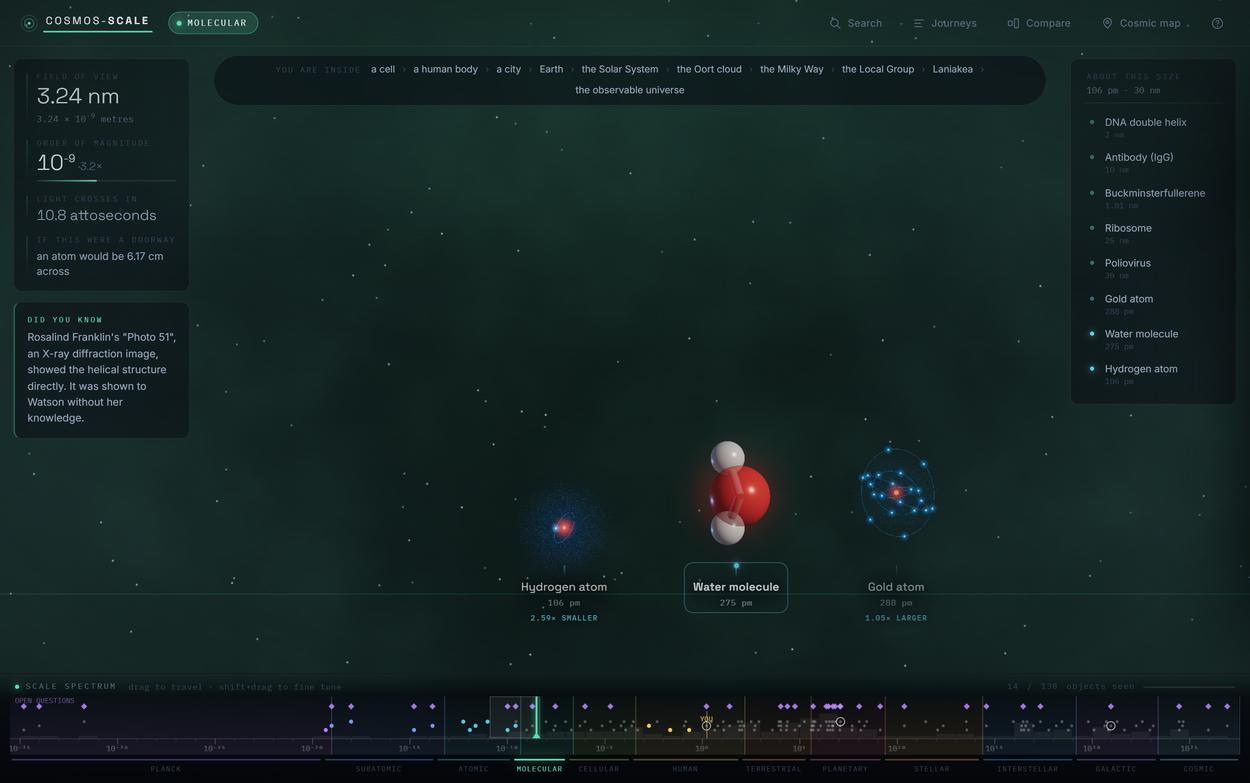
MolecularField of view 3.24 nanometres. Hydrogen atom 106 picometres, water molecule 275 picometres, gold atom 288 picometres, all three on the same line. The gold atom is 1.05 times larger than the selected molecule.
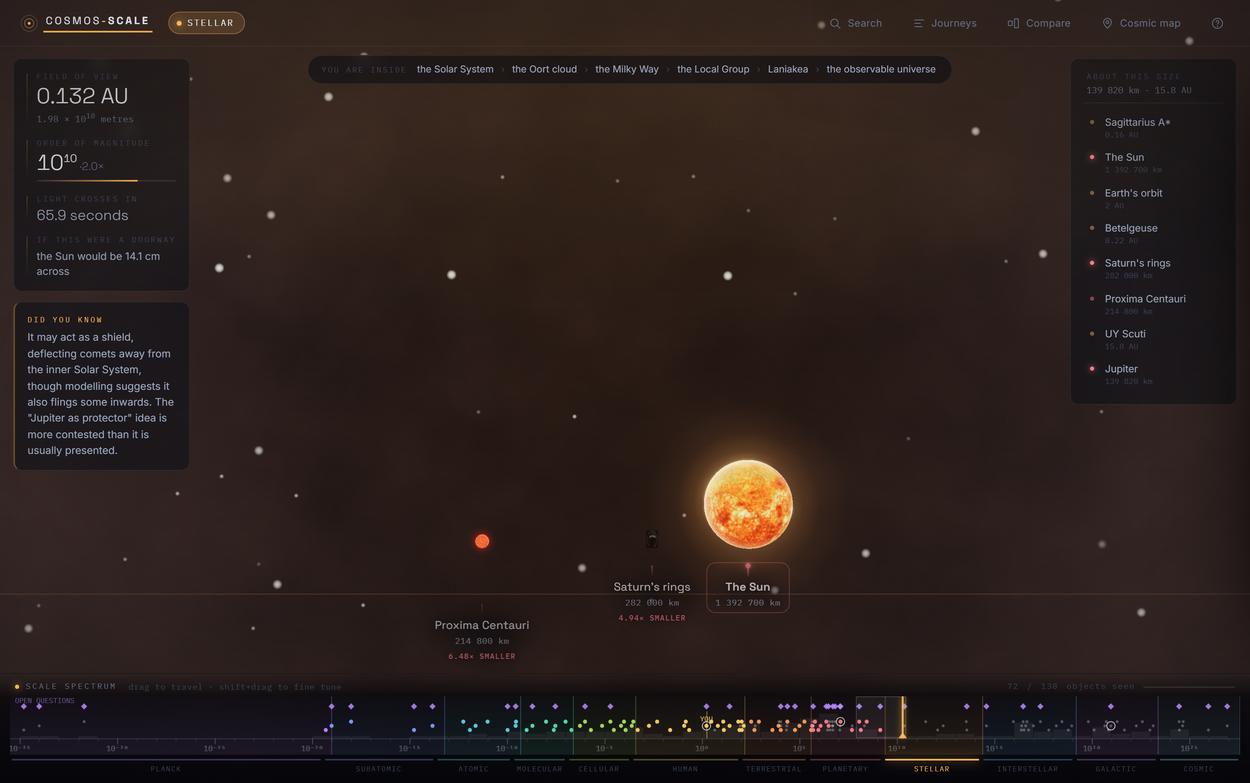
StellarField of view 0.132 astronomical units. The Sun is 1,392,700 kilometres across, Proxima Centauri 214,800. The ratio line underneath reads 6.48 times smaller, which is exactly what the division gives.
All twelve bandsThe three rungs that stood here as stills each showed a single object on an empty field. The sweep replaces them, because stepping from band to band is what this application does, and a still holds none of it.
Nineteen orders of magnitude in one zoom
What is to scale, and what is not
To scale
- The drawn height of every object is the number printed under it.
- The ratio line is computed from both sizes: 1,392,700 divided by 214,800 is the 6.48 printed under Proxima Centauri.
- Position on the ladder is the base-ten logarithm of the size, by the same rule for all 138 objects.
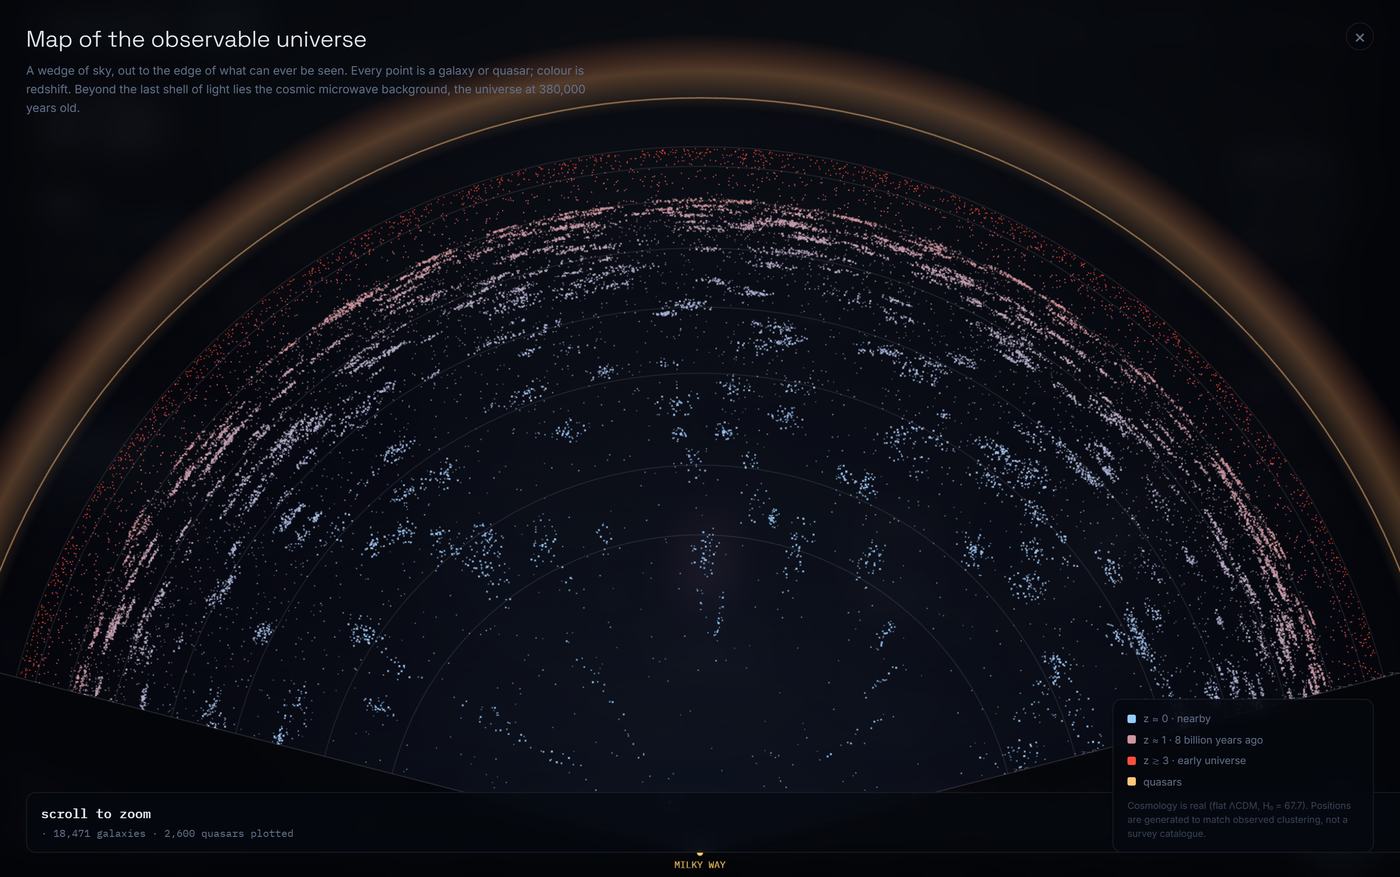
- The cosmology behind the map is real: flat lambda-CDM with H0 = 67.7, and the map prints that on its own face.
Not to scale
- Orientation. Where the quoted number is a length the object is stood upright, which is why the A380 rests on its tail.
- Surfaces. Planetary maps and micrographs are borrowed photographs, credited individually. Only the geometry is built in code.
- The map’s 18,471 galaxies and 2,600 quasars are generated to match observed clustering. It is not a survey catalogue.
- The caption row. On two frames on this page a pair of names overlap, because the packing does not resolve every arrangement.
The dossier computes rather than asserts
Each of the 138 objects can be opened. The dossier names the band and the decade, the size as a number and as a power of ten, a line about what the number actually measures, and three buttons: travel here, compare, open question.
The cosmic web entry shows the separation the application keeps. The stage carries a generated structure; the dossier puts two real photographs side by side, a simulation and a survey, each labelled with where it came from. The panel docks between the top bar and the spectrum, and the stage yields the width instead of disappearing underneath it.
The rest of the ladder
Where a ladder beats a chart
- Scientific and industrial data spanning more orders of magnitude than one chart can hold.
- Museum, exhibition and education work where a visitor has to feel a range rather than read it.
- Any interface where zoom is the primary navigation and the usual answer is discrete tabs.
Image credits: every frame on this page is a screenshot of the Cosmos-Scale application (iiterate Technologies GmbH). The planetary and solar textures shown in it are by Solar System Scope (CC BY 4.0, derived from NASA data); the deep-sky, micrograph and landscape photography is by NASA (public domain), ESA/Hubble, ESO and JWST/STScI (CC BY 4.0), and by NOAA, CSIRO and NIAID.
Why this is published
What this means for your project
More from the lab
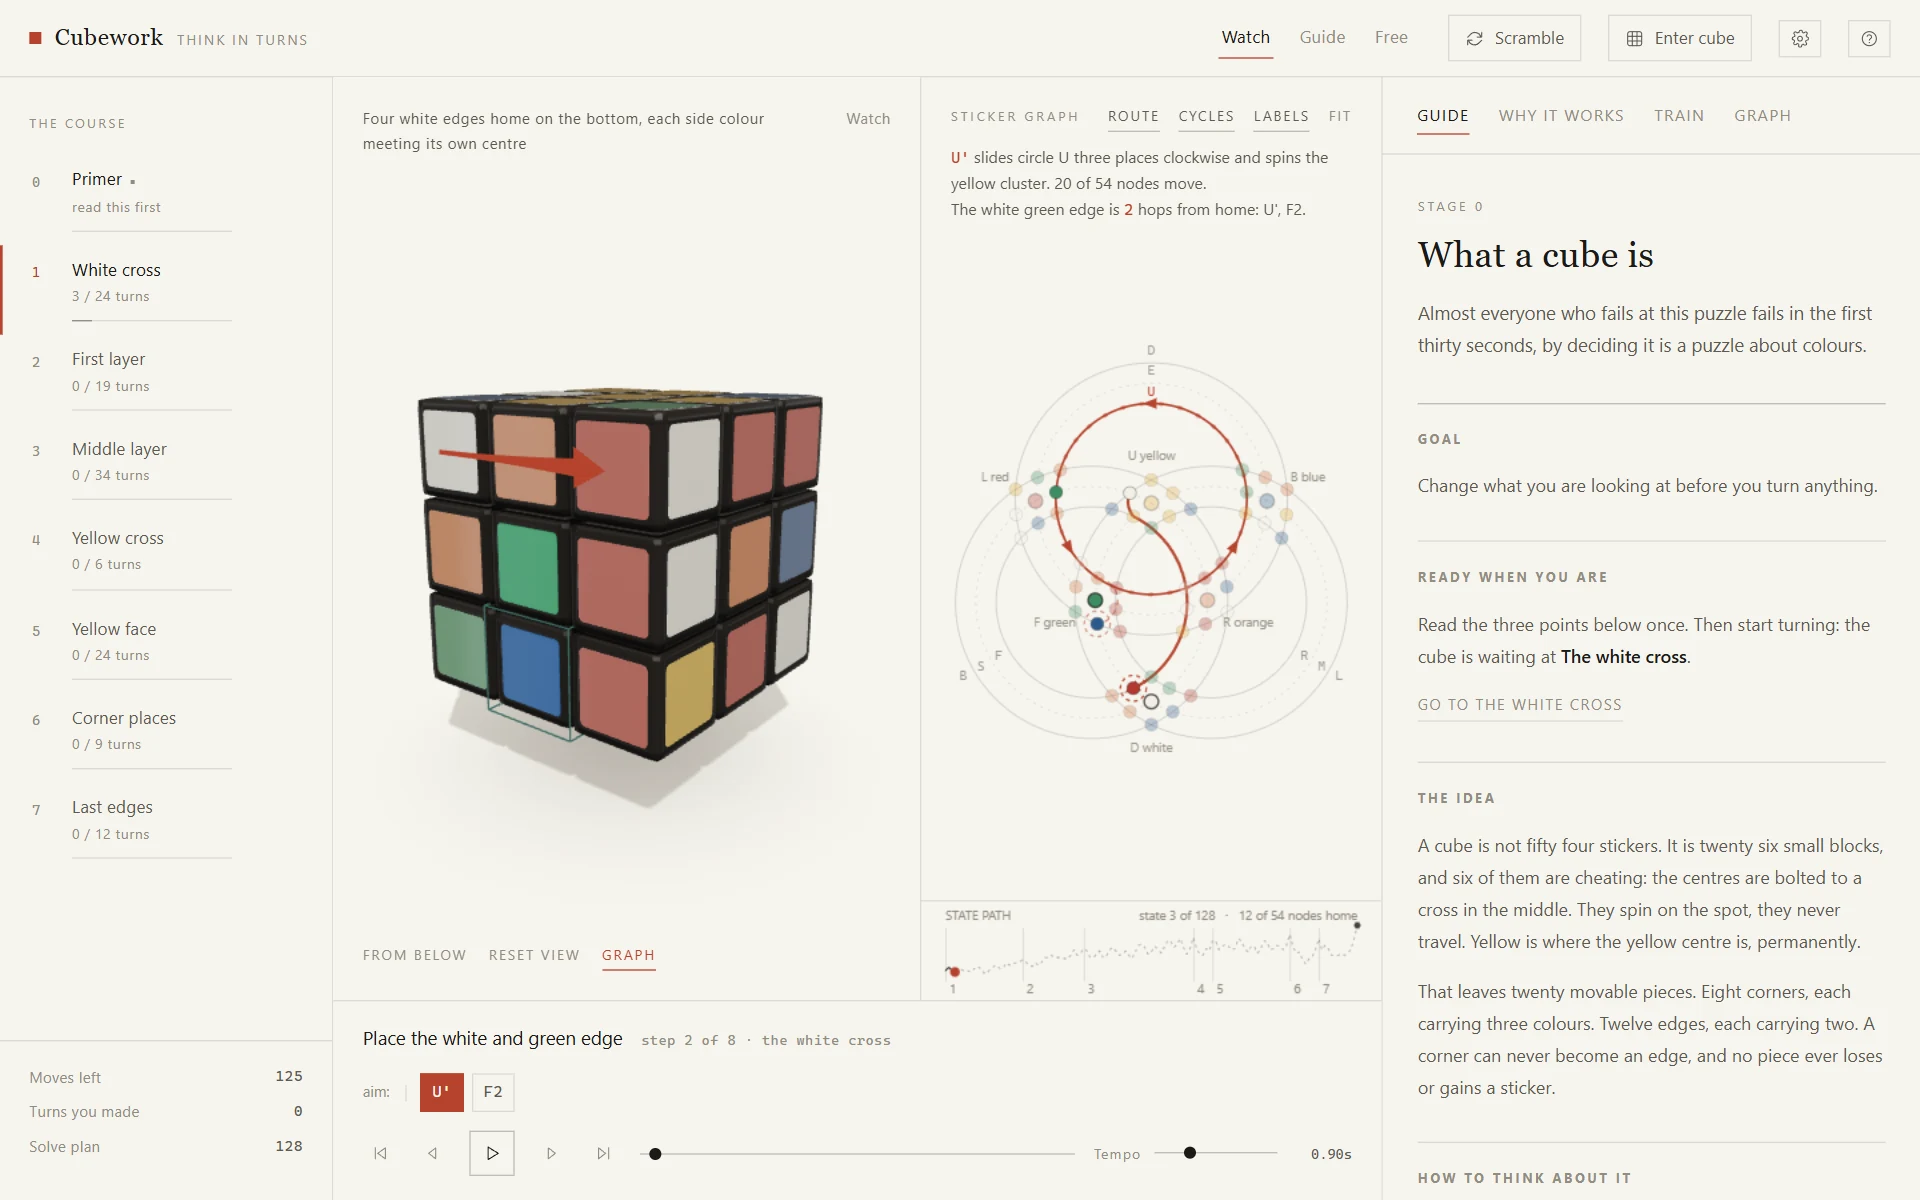
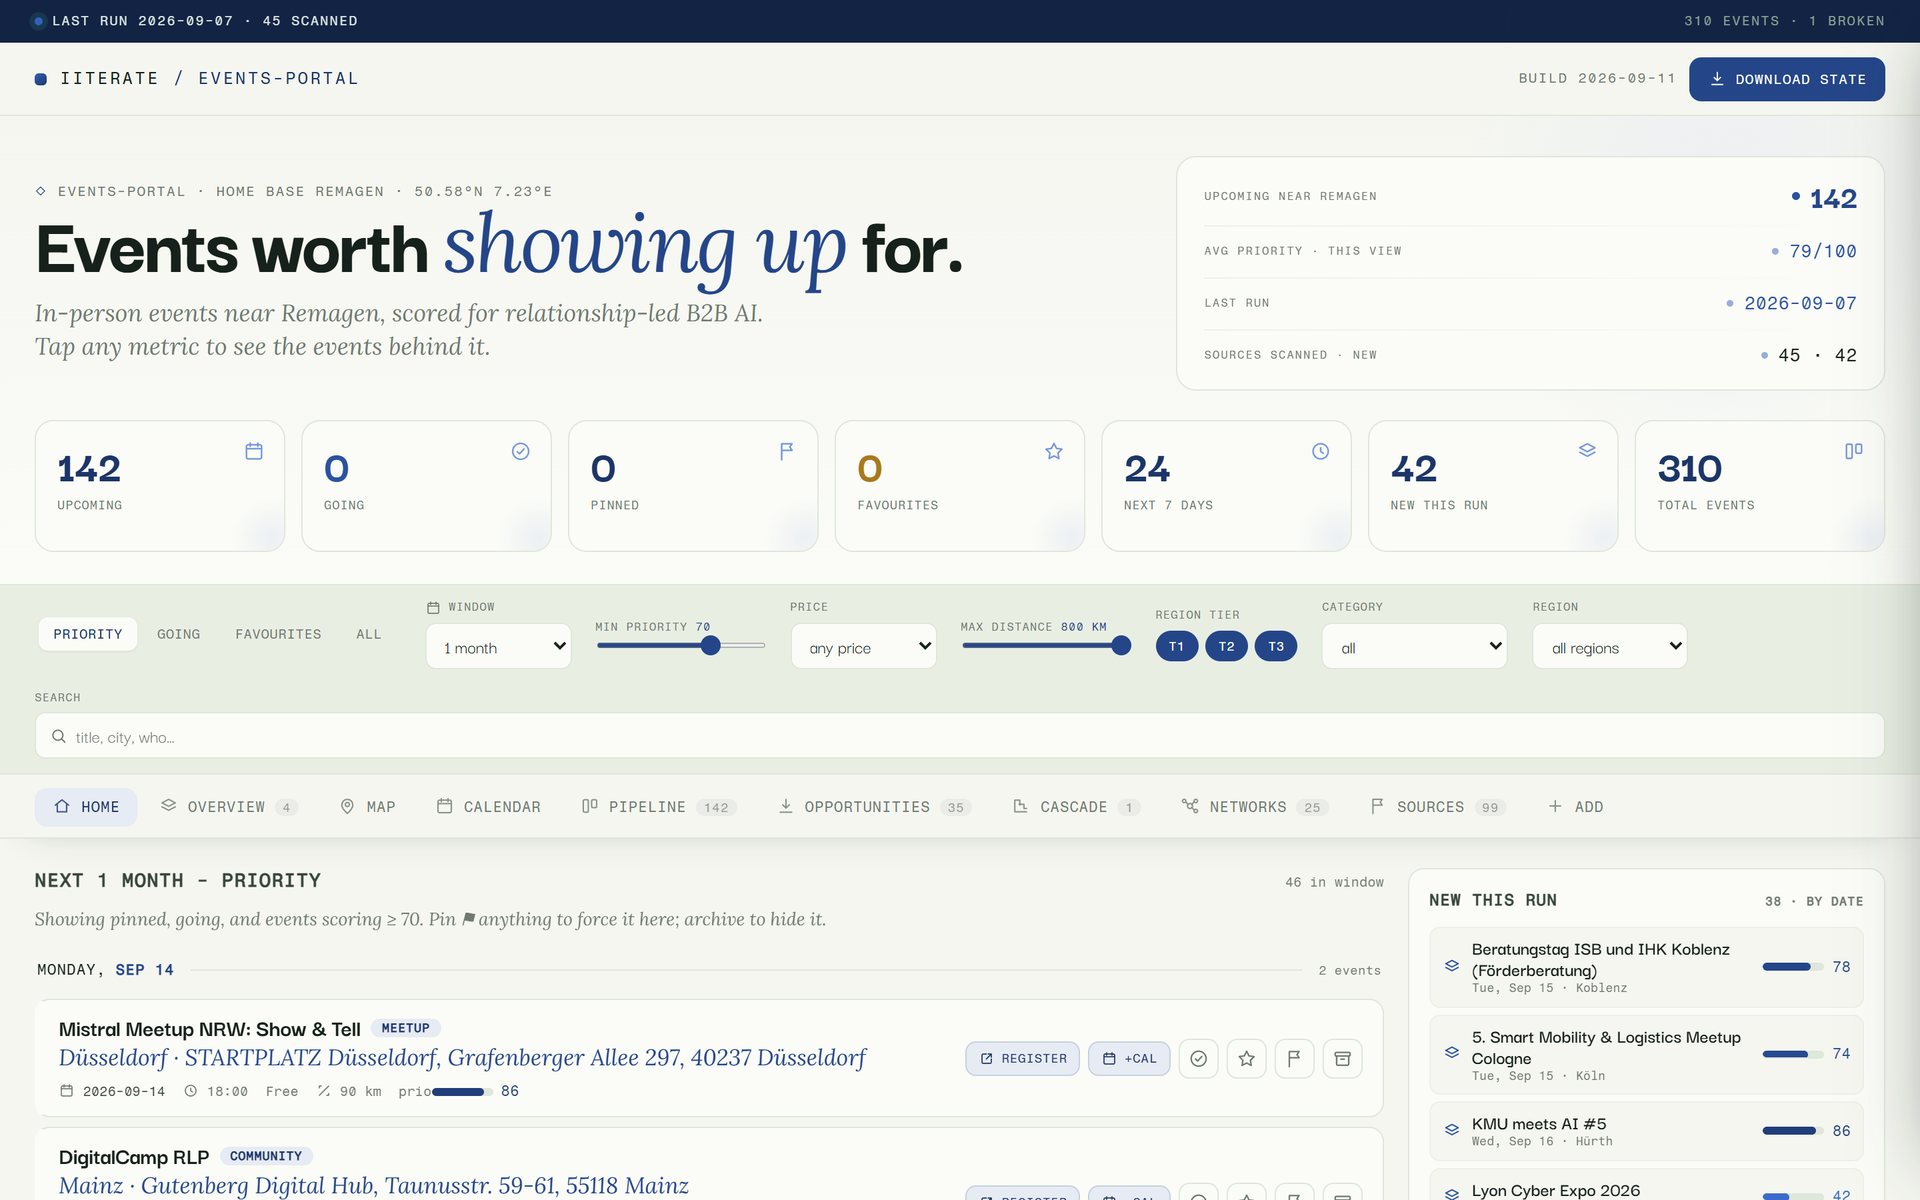 Method Event Scout A language model reads the event pages; everything else is fixed code. What remains is a short list of where a day in person is worth it.
 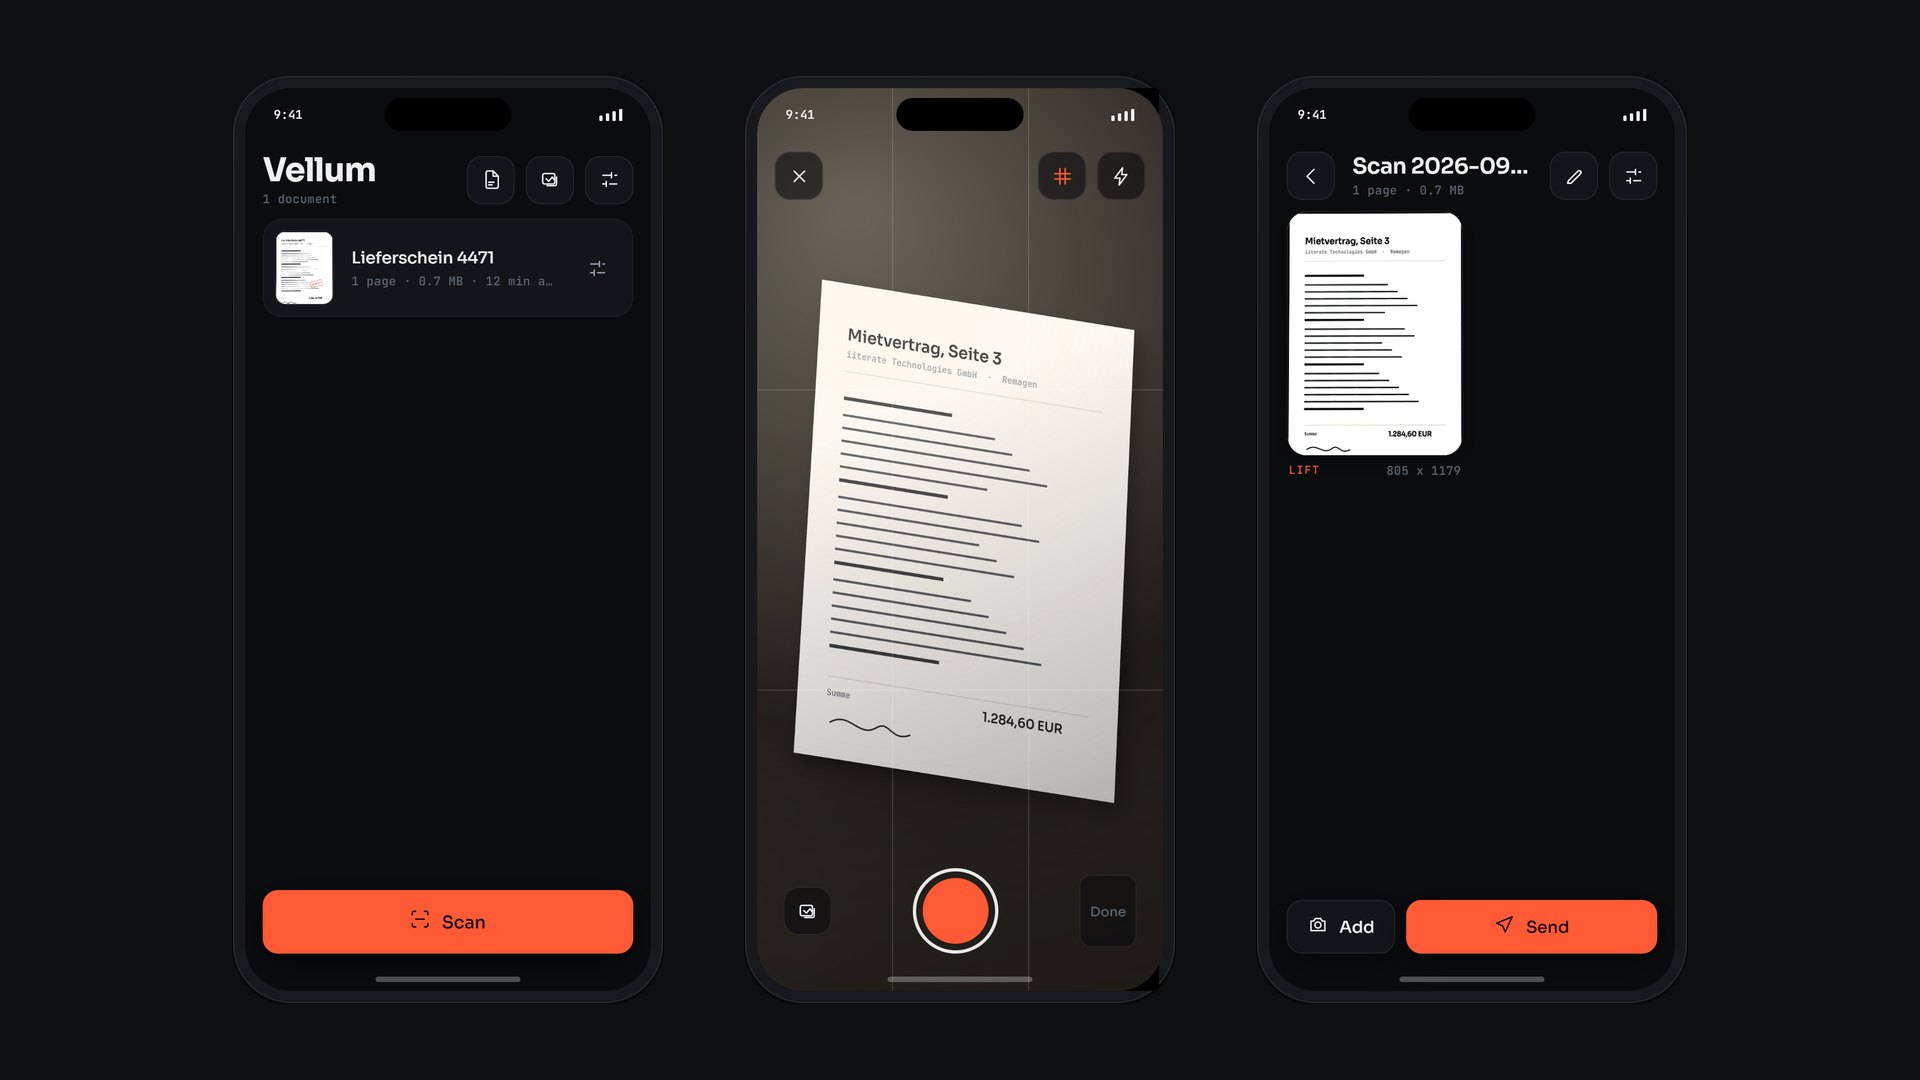 Applied Research Vellum Edges, perspective, light and text are all worked out on the phone. A document leaves the device only when someone sends it.
 A dataset nobody can picture is a communication problem, not a data problem. We take those.
Get in touch